Voting Behavior
Voting Behavior. Non-Voters. In 2000, the population of “of age” voters was 205.813 million The number of those eligible according to age in the 2000 election: 105.397 Just 51.2 % That’s just in the Presidential election

Voting Behavior
E N D
Presentation Transcript
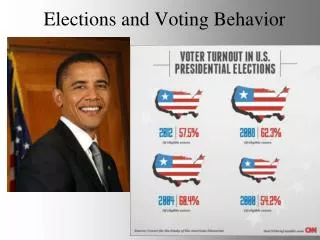
Non-Voters In 2000, the population of “of age” voters was 205.813 million The number of those eligible according to age in the 2000 election: 105.397 Just 51.2 % That’s just in the Presidential election In the 1998 Representative election only 99.457 voted, just 33.9 % of the eligible voters
Non-Voters • As a general rule, the farther down the ballot an office is, the fewer the number of votes that will be cast for it • IE: more votes are cast for president than governor; more votes are cast for governor than statewide offices. More voters in a county usually vote in the races for statewide offices than mayoral elections, etc. • This phenomena is known as “ballot fatigue” • Many voters exhaust their patience and/ or their knowledge as they work their way down the ballot
reasons why people don’t vote 1. Did not register 42% 2. Do not like the candidates 17% 3. No particular reasons 10% 4. Are sick or disabled 8% 5. Not US citizens 5% 6. Not interested in Politics 5% 7. New residents to the area 4% 8. Away from home 3% 9. Cannot leave work 3% 10. Cannot get to the polls 1%
The “Cannot” Voters Approximately 100 million do not vote 10 million are resident aliens who are barred from the polls in every state 5-6 million were so ill or otherwise physically disabled that they simply could not vote 2-3 million traveling suddenly or unexpectedly could not make it to the polls 500,000 in mental health care facilities 2 million in jails or prisons And around 100,000 that do not vote because of religious reasons
Actual Non-Voters • Many do not vote because they believe their vote does not actually count • Electoral college • Some believe that no matter what the turn out things will continue to go well • Some are satisfied with the political world as they see it • Many stay away because they do not trust politicians- they believe that the “government by the people” has been taken over and no longer exists
Factors effecting voter turnout • Factors that discourage voter turnout • Inconvenient registration requirements • Long ballots • Long lines at polling places • Bad weather