Download
1 / 25
260 likes | 352 Vues
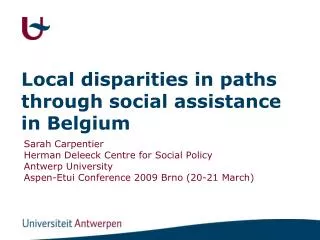
Determinants of leaving the social assistance scheme in Belgium. Sarah Carpentier Herman Deleeck Centre for Social Policy Antwerp University RECWOWE/ Equalsoc Doctoral Research Workshop – Tilburg 19-20 November 2009. Outline. Research question Literature

E N D
Determinants of leaving the social assistance scheme in Belgium Sarah Carpentier Herman Deleeck Centre for Social Policy Antwerp University RECWOWE/ Equalsoc Doctoral Research Workshop – Tilburg 19-20 November 2009
Outline • Research question • Literature • The Belgian social assistance scheme • Hypotheses • Data • Methodology • Evidence • Conclusion
1. Research question • Which are the determinants of leaving the minimum income scheme? Does it matter which welfare agency administers the benefit? • Interplay between individual heterogeneity, socio-economic context and institutions on individual outcomes = a black box • Equal access to social rights in different places
2. Literature • Several explanations for individual variation in duration • Individual characteristics (heterogeneity) Social assistance recipients differ in their individual & household characteristics and their probability of exit • Welfare dependency time on welfare as such decreases the probability of leaving • Labour market situation Time on welfare varies according to qualities of the labour market
2. Literature • Institutional effect Time on welfare influenced by variability in institutional design (national and local policy mix) - generosity - activation policy • Rational choice perspective includes all types of explanations
3. The Belgian social assistance scheme • Overall social protection scheme • flat-rate unemployment benefit for school leavers after a waiting period • Unemployment benefit in principle unlimited in time • Other categorical social assistance schemes (for elderly, handicapped persons, and children) Low % of social assistance beneficiaries in European perspective (0.8% in 2004)
Percentage of adults claiming social assistance by municipality (2004)
3. The Belgian social assistance scheme • Social assistance scheme • Eligibility criteria • 18 years old (except when pregnant/married) • Belgium nationality/legal residency & living in Belgium • Needy according to a family-based means test • Available for work (exempt when exempted) • Unlimited in time
3. The Belgian social assistance scheme • Decentralised organisation (since 1974) • National statutory framework • Social assistance benefit receipt • Activation policy: positive & negative incentives • Local agencies (‘OCMW’/ ‘CPAS’) • Administer federal law with a broad autonomy & margin of appreciation • Take supplementary initiatives according to own insight & to local needs to ensure human dignity Moderate decentralisation in European perspective main areas of local competence: generosity, allocation to training and activation programmes, availability for work assessment
4. Hypotheses • Hypotheses on individual characteristics • longer duration for formerly low work intensity • longer duration for women with children • non-linear relation for age • No clear hypotheses for civil status and non-linear relationship • Hypothesis on time • Negative duration dependency (non-linear relation)
3. Literature • Hypotheses on municipality characteristics • Longer welfare spells in a less favourable socio-economic context • More generous, longer duration • Higher employment programme participation rate, shorter duration
5. Data • Administrative payment records - Data Warehouse Labour Market and Social Security • 1/3 proportionally stratified sample of 2004 cohort entrants (N=5174) in 505 welfare agencies aged between 25 and 55 who were not entitled for at least one year and a quarter before entry in social assistance • Observation window of 36 months, monthly recorded data • Linked with some municipality level data from various sources
5. Data • Welfare agencies administer from 1 to 444 persons in our sample On average 10 persons • Sample characteristics - individuals • 55% women • More than 40% is younger than 35 • 42% has another nationality at birth • 58% couples with/without children, 23% singles • Nearly 50% is married • Mean work intensity over past five years is 34% • 21% in Brussels,35% in Wallonia, 43% in Flanders • 28% lives in big cities • 76% has only one episode, 18% has 2 episodes
5. Data • Sample characteristics - municipalities • Mean unemployment rate: 10% (range: 4-38%) • Mean yearly amount of supplementary benefit per beneficiary: 1760 € (range: 0-9680€) • Mean social employment participation rate: 13% (range 0-50%)
6. Methodology • Multilevel event history analysis accounts for • Dependency of observations (clustering) • Unobserved heterogeneity (! Spuriousness) • Unbalanced design • Timing of events • Censoring • Observing recurrent episodes • Combinations with unemployment benefit or working are allowed at entry • Event: leaving the minimum income scheme • Unspecified exit • Participation in activation programme =exit
Welfare agency 1 Welfare agency 2 Person 1 Person 2 Person 1 Person 2 Person 3 l Spell1 Spell2 Spell1 Spell1 Spell1 Spell2 Spell1
6. Methodology • Strict hierarchies (no cross-classification) • Unique nesting of spells in persons • Unique nesting of persons in welfare agencies • No time-varying covariates for both individual and municipality level characteristics at entry time • Discrete-time framework • Monthly recorded data, though underlying process is continuous • Appropriate for multilevel event history analysis Logit regression of binary response
6. Methodology • Modelling with Mlwin 2.13 • MCMC estimation (= Markov Chain Monte Carlo) • Comparison of nested models by the deviance information criterium (DIC)
7. Evidence • Nulmodel (empty random intercept): • Probability of leaving differs significantly between welfare agencies • Only 5% of variability is situated at municipality level (= theoretical approximation)
Logit for odds of leaving Reference categories: Women, Couple with children, Married & Flanders
*=no improvement of goodness of fit of the model(ns)= not significant
7. Evidence Remarks: • An exit is not necessarily a meaningful improvement of the living standard (Kazepov,1999; Saraceno, 2002; Hansen, 2008) • A short time on social assistance is not necessarily an indication of a good welfare policy (Kazepov, 1999; Saraceno, 2002) Further study of Probability of leaving to multiple exit states Probability of staying in paid labour Income level
8. Conclusion • Mainly individual characteristics account for variability in probability of leaving (age, sex, work intensity over former 5 years, household type, marital status) • 5% of variability in duration is situated at municipality level, not so substantial • At municipality level: evidence for a regional effect and an effect of social employment participation rate No significant effect of unemployment rate, though substantive reduction of the variance at municipality level Small significant effect of generosity, but no improvement of the goodness of fit of the model Evidence suggests time dependency Confirming evidence for both dependency and heterogeneity Mixed evidence for rational choice
Thank you for your attention! Sarah.carpentier@ua.ac.be