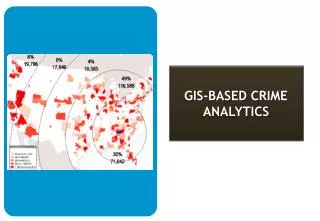

Predictive Crime Analytics
E N D
Presentation Transcript
Predictive Crime Analytics
Project Objective The project aims to analyze the crime data provided by CMPD and design predictive models implementing classification and neural networks to predict: • In how many days a case can be closed • Number of crimes to occur • Case status of an Incident Our goal is to build predictive models based on different inputs, evaluate them and choose the best one.
CMPD DataRetrieval • Time period- 2011-2016 • 42 tables (6 years X 7 tables) • Linked by Complain_No • Imported into an MS SQL Server
Data Enrichment Database CMPD Data Weather Unemployment Twitter Special Events
Joining Data Charlotte Zipcode table was used to filter out all the records other than Charlotte Area Different tables within CMPD database are joined using Unique Complaint_No For Joining other Data Sources we used • Twitter + CMPD using Date • Special_Events + CMPD using Date
Unemployment + CMPD using (Year-Month) Unemployment: Incident:
Weather + CMPD using Date Weather Incident:
Data Processing • The data format was specified • Outliers were replaced with the mean value of the field. Outlier cut off value was set to 3 standard deviations. • Dates & Times cannot be used directly by most algorithms, so we estimated the duration period. • All the missing data entries were replaced with: • Continuous fields: replace with mean • Nominal fields: replace with mode • Ordinal fields: replace with median
Missing Values Treatment • The features with > 50% missing values were excluded. • The rows with > 50% missing values were excluded. • The fields with too many unique categories were excluded (> 100 categories). • The categorical fields with >90% values in a single category were excluded. • Sparse categories were merged to maximize association with target. • Input fields that have only one category after supervised merging are excluded.
Analysis Type of incident distribution
The trend of the number of Incidents over the Incident hour and the case status
Analysis of the vehicle body type that have been stolen most frequently per zip code
Feature engineering Feature engineering is fundamental to the application of machine learning. In order to improve our initial results we used Microsoft SQL Server Management Studio (SSMS) to create the following features: • We created Day of week and time of day features • Time period for a case to be closed was calculated from the reported and clearance date
Predictive Modeling (1) Classification : Decision Tree Tool : SPSS Target : Case_Status Tree Depth : 5 Input : WeekDay : feature extracted from Incident_From_Date (MM/DD/YYYY HHMM).Month : feature extracted from Incident_From_Date (MM/DD/YYYY HHMM).TimeFrame : feature extracted from Incident_From_Date (MM/DD/YYYY HHMM).Place1: General place type (e.g., Residential, Retail, Open Area, etc.)Reporting_Agency : Agency that took the report - Airport Police, Charlotte Mecklenburg PoliceLocation_Type : General location type - Indoors, Outdoors, Parking Lot, Parking Deck, OtherTemp_Range : Discretized feature from the mean temperature Events& Unemployment_Rate : Taken from augmented Weather and Unemployment dataset
Incident_From_Date ( MM/DD/YYYY HHMM) → Discretization → Time Frame Mean Temperature F → Interval Scaling → Temperature_Range
Predictive Modeling (2) Method : Neural Network - Multilayer perceptron Tool : SPSS Target : CLearance TimeFrame Important Predictors : Year MonthIncident_Hour Numeber_Of_Tweets IncidentsMeanTemperature F WeekDay MeanSealevelPressure Day MeanVisibilityMiles
Predictive Modeling (3) Method : Neural Network - Multilayer perceptron Tool : SPSS Target : Number of Incidents Important Predictors : Year MonthIncident_Hour Numeber_Of_Tweets WeekDayMeanTemperature F Unemployement ClearanceTimeFrame Day MeanVisibilityMiles MeanWindSpeedMPH Employment
Accuracy: • Sample size • Ratio between the sample size and the number of features used • The relationship between features • Initial weights and biases • Target variable • Ratio of training set: test set : validation set
Future Work • Improve the individual Model Performance • Add more datasets • Application of Deep-Learning methods • Implement Unsupervised Learning
Credits: Mansi Dubey Madlen Ivanova Preneesh Jayaraj