Download
1 / 65
650 likes | 788 Vues
Climate Change: Understanding the Science and Developing Strategies for Action. Eugene S. Takle, PhD, CCM Professor of Atmospheric Science Department of Geological and Atmospheric Sciences Professor of Agricultural Meteorology Department of Agronomy

E N D
Climate Change: Understanding the Science and Developing Strategies for Action Eugene S. Takle, PhD, CCM Professor of Atmospheric Science Department of Geological and Atmospheric Sciences Professor of Agricultural Meteorology Department of Agronomy Faculty Director, University Honors Program Iowa State University Ames, Iowa 50011 gstakle@iastate.edu Science Center of Iowa 5 March 2007
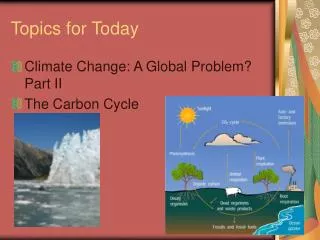
Outline • Changes in atmospheric carbon dioxide • Radiative forcing • Simulations of global climate and future climate change • Climate change for Iowa and the Midwest • Four components for addressing climate change Except where noted as personal views or from the ISU Global Change course or the Iowa Environmental Mesonet, all materials presented herein are from peer-reviewed scientific reports
CO2, CH4 and temperature records from Antarctic ice core data Source:Vimeux, F., K.M. Cuffey, and Jouzel, J., 2002, "New insights into Southern Hemisphere temperature changes from Vostok ice cores using deuterium excess correction", Earth and Planetary Science Letters, 203, 829-843.
CO2, CH4 and temperature records from Antarctic ice core data Source:Vimeux, F., K.M. Cuffey, and Jouzel, J., 2002, "New insights into Southern Hemisphere temperature changes from Vostok ice cores using deuterium excess correction", Earth and Planetary Science Letters, 203, 829-843. Pattern repeats about every 100,000 years Natural cycles
Carbon Dioxide and Temperature 2007 380 ppm
Carbon Dioxide and Temperature 2050 550 ppm
Carbon Dioxide and Temperature “Business as Usual” 950 ppm
Carbon Dioxide and Temperature “Business as Usual” 950 ppm ?
http://www.ncdc.noaa.gov/img/climate/research/2006/ann/glob_jan-dec-error-bar_pg.gifhttp://www.ncdc.noaa.gov/img/climate/research/2006/ann/glob_jan-dec-error-bar_pg.gif
Mann, M. E., R. S. Bailey, and M. K. Hughes, 1999: Geophysical Research Letters 26, 759.
Source: IPCC, 2001: Climate Change 2001: The Scientific Basis
Source: IPCC, 2001: Climate Change 2001: The Scientific Basis
El Chichon (1982) Agung, 1963 Mt. Pinatubo (1991) At present trends the imbalance = 1 Watt/m2 in 2018 Hansen, Scientific American, March 2004
NASA photographs show the minimm Arctic sea ice concentration in 1979 at left and in 2003.Satellite passive microwave data since 1970s indicate a 3% decrease per decade in arctic sea ice extent.
Since 1979, the size of the summer polar ice cap has shrunk more than 20 percent. (Illustration from NASA) (http://www.nrdc.org/globalWarming/qthinice.asp)
Source: Corell, R. W., 2004: Impacts of a warming Arctic. Arctic Climate Impact Assessment (www.acia.uaf.edu) Cambridge University Press (www.cambridge.org).
Kennedy Space Center Impact of a 1-m rise in sea level on low-lying areas Projected sea-level rise In 21st century: 0.5 to 1.0 m Areas subjected to Inundation with a 1 m (~3 ft) rise in sea level Miami Source: Corell, R. W., 2004: Impacts of a warming Arctic. Arctic Climate Impact Assessment (www.acia.uaf.edu) Cambridge University Press (www.cambridge.org).
http://www.ncdc.noaa.gov/img/climate/research/2006/ann/glob_jan-dec-error-bar_pg.gifhttp://www.ncdc.noaa.gov/img/climate/research/2006/ann/glob_jan-dec-error-bar_pg.gif
Natural and anthropogenic contributions to global temperature change (Meehl et al., 2004). Observed values from Jones and Moberg 2001. Grey bands indicate 68% and 95% range derived from multiple simulations.
Natural and anthropogenic contributions to global temperature change (Meehl et al., 2004). Observed values from Jones and Moberg 2001. Grey bands indicate 68% and 95% range derived from multiple simulations. Natural cycles
Natural and anthropogenic contributions to global temperature change (Meehl et al., 2004). Observed values from Jones and Moberg 2001. Grey bands indicate 68% and 95% range derived from multiple simulations. Not Natural
Natural and anthropogenic contributions to global temperature change (Meehl et al., 2004). Observed values from Jones and Moberg 2001. Grey bands indicate 68% and 95% range derived from multiple simulations. Highly Likely Not Nartural Not Natural
Source: Jerry Meehl, National Center for Atmospheric Research
Tropical Atlantic Ocean Hurricane Power Dissipation Index (PDI) Sea-surface temperature V V V Emanual, Kerry, 2005: Increasing destructiveness of tropical cyclones over the past 30 years. Nature, 436, 686-688.
Tropical Atlantic Ocean Hurricane Power Dissipation Index (PDI) Sea-surface temperature V V V Emanual, Kerry, 2005: Increasing destructiveness of tropical cyclones over the past 30 years. Nature, 436, 686-688.
The planet is committed to a warming over the next 50 years regardless of political decisions Source: National Center for Atmospheric Research
The planet is committed to a warming over the next 50 years regardless of political decisions Mitigation Possible Adaptation Necessary Source: National Center for Atmospheric Research
Projected Changes for the Climate of Iowa/Midwest (My tentative assessment) • Longer frost-free period (high) • Higher average winter temperatures (high) • Fewer extreme cold temperatures in winter (high) • More extreme high temperatures in summer (medium) • Higher nighttime temperatures both summer and winter (high) • More (~10%) precipitation (medium) • More variability of summer precipitation (high) • More intense rain events and hence more runoff (high) • Higher episodic streamflow (medium) • Longer periods without rain (medium) • Higher absolute humidity (high) • Stronger storm systems (medium) • Reduced annual mean wind speeds (medium) Follows trend of last 25 years and projected by modelsNo current trend but model suggestion or current trend but models inconclusive
Four-Component Approach for Addressing Climate Change • Mitigation policies: 2050-2100 • Example: reduction in GHG emissions • Adaptation (long-term): 2015-2050 • Example: Developing Iowa’s competitive economic advantage • Adaptation (short-term): 2008-2015 • Example: redefining climate “normals” when needed and scientifically justified • Scenario planning for Iowa’s “Katrina”: 2007-2100 • Example: Multi-year drought, recurrent floods, combination of both; drought and wildfire EST personal view
Climate Adaptation(Short-Term) If a meteorological variable began departing from its long-term background near or after 1970 it may be related to the radiation imbalance and thereby has a better chance than not of continuing its new trend over the next 5-10 years. EST personal view