Download

1 / 25
260 likes | 467 Vues
Developing a GIS based wetland restoration prioritization tool for Minnesota. Jeremy Erickson, Lucinda B. Johnson, Terry Brown, Valerie Brady, Natural Resources Research Institute, University of MN Duluth. Outline. Project objectives Background

E N D
Developing a GIS based wetland restoration prioritization tool for Minnesota Jeremy Erickson, Lucinda B. Johnson, Terry Brown, Valerie Brady, Natural Resources Research Institute, University of MN Duluth
Outline • Project objectives • Background • Available restorable wetland inventories (RWIs) • Supplementing RWIs • Project overview
Objectives • Prioritize areas where wetland restoration will result in the improvement of water quality (N and P) and habitat. • Identify areas that will most likely result in high quality wetlands that will be self-sustaining into the future.
What this tool is NOT… • A site-specific model to identify individual wetlands for restoration; Does not replace: • Wildlife Habitat Evaluation Procedure • Water quality assessments • Local knowledge • Soil loss equations
How this tool could be used… To identify stressed areas that would benefit from wetland restoration To identify areas with the greatest chance for successful restoration To recognize areas where current wetlands should be protected or restored To allow managers and researchers see what types of broad conditions wetlands are being restored in.
MN Restorable Wetland Inventory • MNBWSR - GIS analysis • Ducks Unlimited - photo interpretation • Incomplete areas - CTI/SSURGO method
Restorable Wetland Delineation (CTI/SSURGO method) Required data: • Compound topographic index (CTI): a wetness index estimated from slope and flow accumulation (estimation of soil moisture content). Requires a DEM. CTI = ln (As / (tan(beta)) where As = (flow accumulation + 1 ) *(pixel area m2) beta = slope expressed in radians. • SSURGO drainage data • National Wetlands Inventory (NWI) coverage ESRI: http://arcscripts.esri.com/details.asp?dbid=11863) CTI >10.5 Poorly or very poorly drained soils NWI RWI
Creating RWIs using ArcMap Model Builder DEM to CTI CTI to RWI
Statewide RWI using CTI/SSURGO method • Covers entire state • Can be easily adjusted stricter RWI estimates • CTI threshold • Higher resolution DEM • Can supplement areas without RWIs
Developing the decision tool:overview and vision Web based tool Utilizes readily available GIS data layers
Definitions Decision Layer- one of three primary groups of data which will form the basis of our model, e.g., Stress, Viability, Benefits. Focus Area- distinct ecosystem services that are affected by wetland restoration, e.g. water quality in the form of N and P inputs and habitat. Data Layer- thematic layers representing distinct spatial data inputs, e.g., Land use. Class- distinct classification units for a given data layer, e.g., row crops, high density development.
Wetland restoration decision layers (data layer summary) Viability Final output Stressor Benefits Condition Viability Factors that predict the success (or failure) of restoration Stress Factors that predict the success (or failure) of restoration Benefits Environmental services that will be enhanced by restoration Condition Environmental data that acts as a potential modifier to the final output
ViabilityFactors that predict the success (or failure) of restoration • Ownership • Topography (CTI) • Soil type • Network position
Stress Factors that predict the success (or failure) of restoration • Distance to Roads • Population • Distance to Feedlots (MPCA) Twin Cities • Land use • Open development • Low density development • Medium density development • High density development • Pasture • Row crops
Benefits Environmental services that will be enhanced by restoration • Soil erosion risk • Water quality risk • Wildlife habitat quality • Sites of biodiversity • Species of greatest conservation need • Bird potential habitat • Weighted habitat protection level Environmental Benefits Index
ConditionEnvironmental data that acts as a potential modifier to the final output • MPCA IBI data • MPCA Impaired waters designation (TMDL) • Biological, habitat, and water quality surveys • Surrounding landscape (buffers) • Google or Bing maps • Restorable wetlands inventories
Political boundary Topography Soil type Network location Viability score Ownership Summarizing at the 30 m pixel level Watershed boundary Watershed risk score
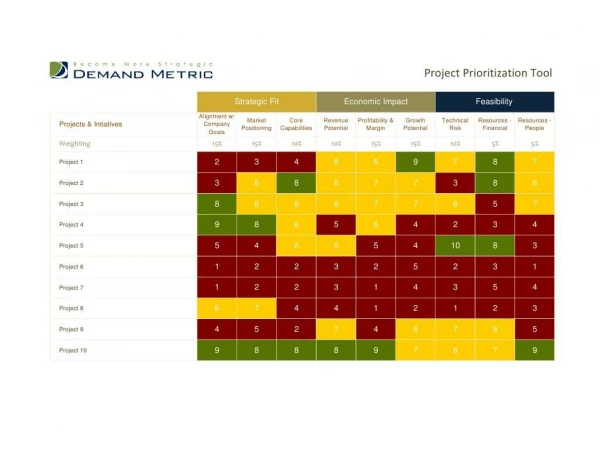
Weighting • Expert panel • Comprised of wetland, hydrology, GIS, and landscape experts • Survey Monkey (http://www.surveymonkey.com ) • N and P • Habitat • Weighting discussion • Additional data layer discussion • Literature review
Categorical layer weighting Not hydric 1 Soil type 2 Unknown 1 2 3 3 4 Partially hydric 4 All hydric Each pixel is assigned a score based on class weight Variable class Data Layer
Continuous data: example 1 Maximum effect threshold No effect threshold High stress Gradual stress reduction No stress High stress Gradual stress reduction No stress
Continuous data: example 2 Pixel population normalized 100 50 x’ = (x-xmin)/(xmax-xmin) x’ = (100-50)/(150-50) 150 x’ = 0.5 Population tracts
Habitat suitability Spatial tool schematic Habitat Terrestrial value Soil erosion Water quality (N or P) Benefit Water quality Network 1 2 Ownership Habitat 1 1 Topography 1 Soil type Soil type Viability Final output 1 1 Network Not hydric 1 1 Ownership Water quality (N or P) 2 Topography 2 Unknown 1 2 2 Condition Soil type 3 3 4 Partially hydric Land cover 4 Roads All hydric Habitat Population Feedlots Stress Land cover Roads Water quality (N or P) Population Feedlots Focus areas Decision layers Class Data layers
Scenario A: low stress/high viability • Low stress areas • High viability • Restorable wetland locations Carver County
Scenario B: high stress • Locate highly stressed areas • Less concern about viability • Locate restorable wetlands Carver County Bluff Creek
Questions….. Contact: Jeremy Erickson Natural Resources Research Institute University of Minnesota Duluth 218-720-4320 eric0792@d.umn.edu