
Photosynthetic Response of Emiliana huxleyi to Variable Light Conditions in Marine Ecosystems
This study examines the photosynthetic efficiencies of the coccolithophorid Emiliana huxleyi under varying light conditions in natural marine environments. Utilizing typical irradiance profiles, we explore the impact of light levels on cellular efficiency and acclimation. The findings indicate significant differences in photosynthetic responses between low and high light conditions, with implications for understanding biogeochemical processes and carbon cycling in the oceans. Our research highlights the vulnerability of E. huxleyi to changes in light, affecting its role in marine ecosystems.

Photosynthetic Response of Emiliana huxleyi to Variable Light Conditions in Marine Ecosystems
E N D
Presentation Transcript
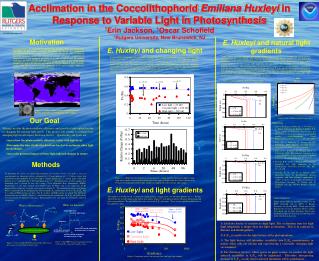
bright light flash CO2 180oW 135oW 90oW 45oW 0 45oE 90oE 135oE 180oE QA 90oN medium light levels Fd CH2O Fluorescence 60oN Kd = 0.6 QB 2H+ Kd = 1 e - 5 m 30oN Fm - Fo = Fv PQH2 4 m darkness PS II PS I 0o P680+ 2H+ Ft some PSII closed, probability of fluorescence is variable FO all PSII open, probability of fluorescence is low 30oS z Light-Harvesting Pigments 60oS Fm all PSII closed, probability of fluorescence is high O2+ 4H+ 2H2O 90oS PAR 1E-307 1E-157 1E-7 0 Kd = 0.1 Kd = 0.1 Kd = 0.3 10 Kd = 0.6 12 m Kd = 1 20 30 Depth (m) 40 50 60 Figure 6: An irradiance profile from nature. 0.7 0.6 0.5 0.4 Fv/Fm 0.3 Low light 0.2 Constant light 0.1 High light 0 1 10 100 1000 Irradiance Acclimation in the Coccolithophorid Emiliana Huxleyi in Response to Variable Light in Photosynthesis 1Erin Jackson, 1Oscar Schofield 1Rutgers University, New Brunswick, NJ ErinSJ@eden.rutgers.edu Motivation E. Huxleyi and natural light gradients E. Huxleyi and changing light Phytoplankton make up at least 8 phylogenetic divisions. They also significantly contribute to the largest reservoir of carbon on Earth, the carbonates. Coccolithophorid species, such as Emiliana Huxleyi convert the largest amount of dissolved inorganic carbon and calcium to calcium carbonate1. Important to biogeochemical and ecological processes, it is vital to understand the optimal conditions for their growth and efficiency. Figure 1 shows a Sea WiFS image mapping the global distributions of an Emiliana Huxleyi bloom in white1. Satellite images show that E. huxleyi blooms primarily in the polar regions, which are known as highly turbulent ocean environments. Using typical irradiance profiles from nature (Figure 6) it is possible to estimate the photosynthetic efficiencies in the water column. We estimated the potential curves for the control, low, and high light conditions. Given cells circulate throughout the water column in the upper mixed layer we might expect cellular signatures for low to high light transitions and vice versa. This variability will be expected for populations in nature. We calculated the Fv/Fm profiles over a range of water column turbidities (when Kd is high, the water column is more turbid). Figure 5 shows the range of Fv/Fm profiles that might be encountered. The differences in the Fv/Fm curves for a given Kd reflect only the cellular response to a changing light environments. As readily evident the Fv/Fm profiles are very sensitive to the light history of the cells. This means that data collected in the field includes this variability. In the presence of changing light, it is apparent that E. Huxleyi is most vulnerable to a change from low light to high light (Figure 4). Figure 4a illustrates the Fv/Fm readings taken over 5 days after a light shift. Relative to the control, the low light culture increased slightly (~17%) and appeared to be acclimated to a relatively steady state after 1 day. In comparison, the high light culture decreased significantly (~30-50%), reached a low steady state after 2 days, and never recovered to the control efficiencies (Figure 4). The photosynthetic efficiency is much more variable in the high light culture. Results suggest that it takes longer to acclimate to high light. This is in contrast to diatoms2,3 and dinoflagellates4,5. Ed Figure 5: Photosynthetic yields in a water column. m = 0.37 m = 0.33 m = 0.32 Figure 1: Satellite imagery shows coccolithophorid blooms primarily occurring in the polar regions. OurGoal • References • Iglesias-Rodriguez, Debora M., C. W. Brown, S. C. Doney, J Kleypas, D. Kolber, Z. Kolber, P. K. Hayes and P. G. Falkowski. Representing key phytoplankton functional groups in ocean carbon models: coccolithophorids. Global Biogeochemical Cycles, 16 (4): 1100-1120, 2002. • Post, A.F, Z. Dubinsky, K. Wyman and P.G. Falkowski, 1984. Kinetics of light-intensity adaptation in a marine planktonic diatom. • Post, A. F., Dubinsky, K. Wyman and P. G. Falkowski, 1985. Physiological responses of a marine planktonic diatom to transitions in growth irradiance. Mar. Ecol. Prog. Ser. 25: 141-149. • Prezelin, B.B., and H. A. Matlick, 1983, Nutrient-dependent low light adaptation in the dinoflagellate, Gonyaulax polyedra. Mar. Biol. 74: 141-150. • Prezelin, B. B., and B. A. Boczar, 1986. Molecular bases of phytoplankton spectral properties, and their potential applications to studies in optical oceanography. In: Progress in Phycological Research. (F. Round and D. Chapman, eds.) pp. 349-464. Biopress Limited, Bristol. • Mixing can alter the photosynthetic efficiency and growth of phytoplankton due to changing the ambient light levels. This project will attempt to evaluate how changing light levels impact Emiliana huxleyi. Specifically, our goals are: • Assess how the photosynthetic efficiency varies with light level. • Determine the time it takes for Emiliana huxleyi to acclimate when light levels change. • Assess the potential impact of these light induced changes in nature. Kd = 0.3 7 m Methods To determine the effects of varied light intensities on Emiliana huxleyi, we made a series of measurements on laboratory cultures acclimated to 100 mmol photons m-2 s-1. Cultures where then transferred to three different levels (low light = 25mmol photons m-2 s-1, control light = 100 mmol photons m-2 s-1, and high light = 500 mmol photons m-2 s-1). The fluorescence of these samples was monitored over a period of five days using a Fast Repetition Rate Fluorometer (FRRF). Fluorescence is the light emitted from Photosystem II (PSII) and is an expression of the photosynthetic efficiency, or health, of an organism (Figure 2). The maximum quantum yield during PSII is calculated from the minimum (F0) and maximum (Fm) fluorescence levels as (Fm-F0)/Fm. The Fo is when all PSII systems are open. The Fm is when all PSII systems are closed. The difference between the two is called Fv (Figure3). After following the acclimation, the Fv/Fm for each culture was measured at 14 different irradiances. Measurements were also taken for cell number and total absorption. Figure 4: a.) Represents the periods of acclimation for a sample transferred from low light to high light and a sample transferred from high light to low light. b.) Represents the relative change in the Fv/Fm for the high light and low light samples in comparison to the constant light sample. E. Huxleyi and light gradients The response in Fv/Fm for all 3 cultures to a light gradient, ranging from 2 to 300 mmol photons m-2 s-1. Results showed that the overall shape in the curves was similar (Figure 5) with photosynthetic efficiency decreasing with increasing irradiance. The only differences were seen in the Fv/Fm intercepts. There was no significant difference in the inhibitory slopes. Acknowledgements Thank you to NSF for providing funding for the RIOS internship and to IMCS at Rutgers University for hosting RIOS. Thank you to Alex Kahl for the use of his Emiliana Huxleyi culture. Also thank you to Sybil Seitzinger, Ron Lauck, and Rachel Sipler for their help and allowing me to work with them in their lab. What we measure? What is fluorescence? Slope = -0.0007 Intercept = 0.34 Slope = -0.0005 Intercept = 0.38 Slope = -0.0005 Intercept = 0.41 1) Emiliana huxleyi is sensitive to high light. The acclimation time for high light adaptation is longer than low light acclimation. This is in contrast to diatoms and dinoflagellates. 2) Fv/Fm is sensitive to the light history of the phytoplankton. 3) The light history will introduce variability into Fv/Fm measurements in nature when cells are mixing and experiencing a constantly changing light environment. 4) For Emiliana huxleyi, which grows in polar oceans, we predict the light induced variability in Fv/Fm will be significant. Therefore, interpreting declines in Fv/Fm as only due to nutrient limitation will be problematic. Figure 3: The FRRF measures maximum quantum yield, or Fv/Fm, using the Fo and Fm values. Figure 2: Cells use light from PSII and emit what light energy they cannot use in the form of fluorescence. Figure 5: Irradiance curves for constant, low, and high light samples.