Download
1 / 24
240 likes | 453 Vues
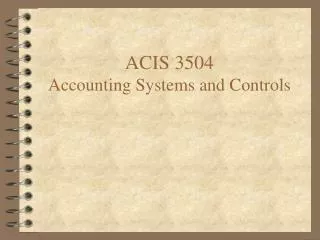
The ACIS Contamination and a Proposed Bakeout CXC SOT & FOT, ACIS Instrument Team and MSFC Project Science. Contributors to the Bakeout Effort.

E N D
The ACIS Contamination and a Proposed Bakeout CXC SOT & FOT, ACIS Instrument Team and MSFC Project Science
Contributors to the Bakeout Effort The``ACIS Contamination Working Group’’ has been studying the ACIS contamination issue for the last two years. This presentation is a summary of that work. Those contributing directly to this presentation: CXC: P. Plucinsky, A. Vikhilin, H. Marshall, N. Schulz, R. Edgar, D. Schwartz, S. Wolk, H. Tananbaum, J. DePasquale, S. Virani, D. Dewey, L. David MIT: M. Bautz,C. Grant, W. Mayer, R. Goeke, P. Ford, B. LaMarr, G Prigozhin, S. Kissel, E. Boughan PSU: G. Garmire, L. Townsley, G. Chartas, D. Sanwal, M. Teter, G. Pavlov MSFC: S. O’Dell, D. Swartz, M. Weisskopf, A. Tennant, R. Elsner NGST: M. Mach, P. Knollenberg, D. Shropshire, L. McKendrick, R. Logan, R. Giordano, T. Trinh, K. Chen, K. Henderson, F. Cottrell, J. Lamb, D. McGregor, H. Tran, D. Lindemann, L. Harper, L. Ryan, A. Tao LMA: N. Tice McMaster University: A. Hitchcock Many others have contributed directly or indirectly.
New Items since Last CUC Briefing (January 2004) • OBF tests are complete at NGST, spare OBFs survived • Found a way to warm the top of the ACIS collimator and the SIM aperture around the ACIS collimator which leads to a more successful bakeout • New bakeout simulation SW from MSFC, allows a detailed tracking of contaminant migration on relevant surfaces as a function of time during the bakeout • New idea proposed for explanation of CTI increase • New analysis of the external cal source data challenges one of the model assumptions
Decrease in Effective Area vs. Time S3 (BI) CCD
C Edge S3 (BI) CCD F Edge O Edge
RISK #2: Thermal cycling results in Damage to the ACIS OBF (Part II) Summary of NGST Tests: Executed in March and April 2004
RISK #2: Before and After Pictures of the OBF Tests (Part III) OBFs with thick layer of contaminant OBFs at the completion of the tests RESULT: There was no damage to the OBFs at any point during these tests.
Chandra X-Ray Observatory ACIS Location OBA Vent Locations Contaminate Migration Path Optical Bench Assembly (OBA) Integrated Science Instrument Module (ISIM)
Simulations of contamination migration Steve O’Dell & Doug Swartz (MSFC/ Project Science) • Simulation methodology • Developed code to simulate numerically contamination migration within CXO. • If present on a surface, contaminant vaporizes at a temperature-dependent rate. • Use Clausius–Clapeyron scaling of temperature dependence — factor of 2 per 5C. • Contaminant deposits from other surfaces based on their view factors and rates.. • Need area, view factor, and temperature of each node in CXO model. • Use NGST’s TRASYS output for geometry — area and view factor of each node. • Use LMC’s thermal predictions for temperature of each node in ACIS cavity. • Use NGST’s thermal predictions for temperature of each node elsewhere on Observatory. • Mass vaporization rate (vapor pressure ) of contaminant • Observed column gradient on OBF constrains vaporization rate of contaminant. • If caused by OBF temperature gradient, deduce a “measured” vaporization rate at -60C. • 7.110-8mg cm-2 s-1 (Pv 1.310-15 atm, 350 amu) @ T1 = -60C. • Extrapolate to other T using a reasonable effective vaporization enthalpy (90 kJ mole-1). • 6.410-2mg cm-2 s-1 (Pv 1.310-9 atm, 350 amu) @ T = +20C. • If not caused by OBF temperature gradient, have only an upper limit to vaporization rate. • Alternatively, assume a “bad-player” contaminant as a “worst case”.
Geometric model OBA vent SIM focus structure SIM translation table Optical bench (OBA) ACIS collimator Snoot OBA stove pipe ACIS camera top ACIS OBF TRASYS model by NGST/ H. Tran et al.
1 d Nominal bake-out Temperatures:TFP = +20CTDH =+25CAbort heat “on” Vapor pressures: 1.310-15 atm @-60 1.310-9 atm @+20(610-2mg cm-2 s-1) 1: ACIS OBF 2: Camera top 3: ACIS snoot 4: ACIS collimator 5: SIM transl table 6: SIM focus struct 7: OBA stove pipe 8: Optical bench 9: OBA vent
1 d 2 d 3 d 4 d Sub-nominal bake Temperatures:De-rate all -2.5C. Vapor pressures:De-rate by another factor of 2. Net de-rating is factor of 3. 1: ACIS OBF 2: Camera top 3: ACIS snoot 4: ACIS collimator 5: SIM transl table 6: SIM focus struct 7: OBA stove pipe 8: Optical bench 9: OBA ventNIL FS bottom 0C NIL
1 orbit 2 orbit 3 orbit Dependence on focal-plane temperature TFP TOBF-C Cold bake-out (TFP << +20C): Contamination on OBF shows large initial increase. Timescale is very long to clean OBF. Timescale to vent all contamination is even longer. The warmer, the better. +16 C+9 C+3 C-5 C
CTI Increase predictions from C impurity model (Bautz, MIT) a Relative to lab test device. bArbitrary units. c 150 ks duration @ focal plane temperature = 20C
FWHM vs. row number for -120 C and -120 C (CTI corrected) and for 15.0 & 25.0 % CTI Increases Predictions for FWHM include the 10% increase in CTI from 2000 to 2004 and the estimated 15.0% and 25.0% increase due to the bakeout.
Impact on GTO AO-5 Proposals Question 1: Were there any targets for which you wanted to propose but did not because the observation was no longer feasible ? Question 2: Were there any targets for which you increased the exposure time due to the contamination layer ? If yes, how many and by how much ? Question 3: How many targets were unaffected ? ~700 ks for each GTO team in AO-5 #1 #2 #3 _ ACIS GTO Team HRC GTO Team HETG GTO Team
Comparison Between GTO and GO AO-5 Proposals AO-5 Distribution of Science Classes • Comparison between GTOs’ and GOs’ instrument configurations • Comparison between GTOs’ and GOs’ observing categories AO-5 Distribution of Instrument Configurations
Benefits of the Bakeout • Restore the HRMA+ACIS effective area to close to launch values and restore the original margin against the level 1 requirements • Provide an additional 2.8 Million seconds of observing time per AO, which will be ~54 additional Chandra observations per AO • Restore classes of targets with soft spectra which are not currently feasible (such as supersoft sources, neutrons stars with soft spectra) Costs of the Bakeout • The bakeout and calibration observations will take ~ 1 Million seconds. Given that the contaminant accumulation is slowing in time and we have gone 5 years without a bakeout, we expect that we would not desire another bakeout for at least another 5 years. • The likely CTI increase of the FI CCDs will impact observations of extended objects on the I array through degraded spectral resolution • The delay in some analyses until updated calibration products are available
7. Operational Plans for a Bakeout • Bakeout History: • The instrument was designed to be baked out. It was thermally cycled from FP < -100 C to +30 C over 40 times on the ground • The pre-launch contamination control plan included regular bakeouts of the ACIS instrument to remove the contaminants. • There have been 4 bakeouts performed in flight, two with the FP to +30 C and two with the FP to -60/-50 C. All four of these bakeouts were executed in 1999.
Possible FP=+20 C, DH=+20 C Bakeout Profile Model predicts OBF is clean Model predicts all contaminant has vented
Calibration Plans for Bakeout • The CXC calibration group has developed a plan of calibration observations before and after the bakeout for roughly a million seconds. • There will be no calibration data collected during the bakeout, however the first calibration observation after the bakeout will be a 30 ks observation of the external calibration source which will tell us immediately the success level of the bakeout. • There are 5 orbits of calibration data to be acquired after the bakeout. We expect that there will be two orbits of HRC observations. ACIS science observations should resume on the eight orbit after bakeout. • The limiting factor on when the data will be useful to GOs is when the CXC calibration team can produce new calibration products for the post-bakeout performance. We believe we will have all of the necessary SW in place by the bakeout. The calibration team believes that the time required to generate new products depends on both the level of removal of the contaminant and the magnitude of the change in the CCD performance. The estimates range from one to five months.
ACIS Bakeout Timeline with Calibration Observations PKS2155 Abell 1795 ACIS Bakeout CTI E0102 HRC GO Targets ACIS GO Tagets Calibration Activity First Indication Of Bakeout Success 0 1 2 3 4 5 6 7 8 9 10 0 25 days Orbits
Work Still to be Done (June 2004) • New analysis of the external cal source indicates that the contaminant is growing at the same rate in the centers and edges of the OBFs. This is not consistent with the assumption in the bakeout simulation model. We need to understand the explanation for this. • Bakeout was tentatively scheduled for mid-Spetember 1999 • Final MSFC Project approval was expected sometime in mid-August. We need to respond to action items from June 8th, 2004 meeting at MSFC before proceeding.