
Uploaded by
carl
2 SLIDES
192 VUES
20LIKES
DESCRIPTION
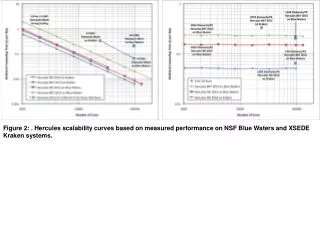
Figure 2: . Hercules scalability curves based on measured performance on NSF Blue Waters and XSEDE Kraken systems.
Download
1 / 2
Télécharger la présentation 
An Image/Link below is provided (as is) to download presentation
Download Policy: Content on the Website is provided to you AS IS for your information and personal use and may not be sold / licensed / shared on other websites without getting consent from its author.
Content is provided to you AS IS for your information and personal use only.
Download presentation by click this link.
While downloading, if for some reason you are not able to download a presentation, the publisher may have deleted the file from their server.
During download, if you can't get a presentation, the file might be deleted by the publisher.
E N D
Presentation Transcript
Figure 2: . Hercules scalability curves based on measured performance on NSF Blue Waters and XSEDE Kraken systems.
Figure 4: Hercules scalability curves based on measured performance on ALCF Blue Gene/Q (Mira), NSF Track 1 (Blue Waters) and XSEDE Track 2 (Kraken) systems. Benchmarking on Mira for this allocation was only completed for the strong scaling curve from 8K to 32K cores (using 32 processes per node). These initial results, though limited, indicate that Hercules will sustain the excellent scalability shown in other machines, for which the computational readiness of the code is well established.
More Related