Download
1 / 70
710 likes | 967 Vues
National Household Travel Survey California Data (NHTS-CA). Planning Horizons December 11, 2013 10:00-12:00 Office of Travel Forecasting and Analysis Caltrans, Division of Transportation Planning. Man Asked: Who am I ? Where am I ? How did I get here? How Do I Get There?. In Antiquity.

E N D
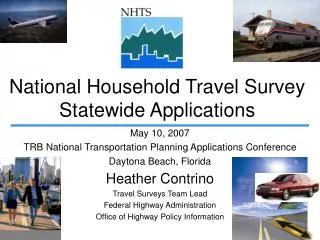
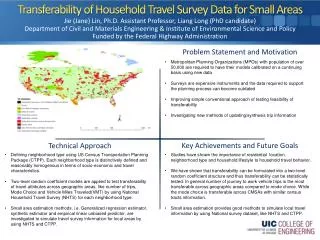
National Household Travel SurveyCalifornia Data (NHTS-CA) Planning HorizonsDecember 11, 201310:00-12:00 Office of Travel Forecasting and Analysis Caltrans, Division of Transportation Planning
Man Asked: • Who am I ? • Where am I ? • How did I get here? • How Do I Get There? In Antiquity
Today, these questions and a lot more are answered in the Household Travel Surveys Who - Socio-economic characteristics of Persons, Households, Workers and Drivers Where – Live, Work, Shop, Play Why – Activity, Origin/Destination What – Vehicles, Transportation Issue When – Time , Day of the Week How - Mode, VMT (how far - miles), VHT (how long – hours) mode
Distribution of Incomes for One Adult, Youngest Child 0-5 Households
Average Minutes Spent Driving Per Person, Per Day Sacramento, Los Angeles, San Diego and San Francisco by Household Composition
Objective of SCAG Study • Is to use NHTS data to provide updated travel characteristics for SCAG region. • This presentation includes results of following analysis: • Overall demographics and travel characteristics • Relation between residential location and commuting • Assimilation of Hispanic immigrants’ travel behavior • Income interaction with land use – transportation relation • Results will be provided to SCAG modelers and planners for their analysis. Source: Residential Land Use, Travel Characteristics, and Demography of Southern California – presented by the Southern California Association of Governments
* Demographics & Travel Travel by Age Daily Trips and Distance by Age • Daily trips and travel distance are the highest for the working age population (25-64). • The elderly still rely on a car, but drive less. Auto Use by Age 21 21
Travel by Age (Elderly) * Demographics & Travel % of Persons Did Not Travel • 20% - 33% of the elderly did not travel on the survey day. • However, when they travel, their trips are no less than the younger. Non-work Trips by Age
Time of Day by Purpose * Demographics & Travel lunch school school open hours 23
Residential Density & Commuting Distance * Residential Location and Commuting • Living in higher density neighborhoods: • Shorter commuting distance. • Commuting time is about the same for all density. 24 Density from low to high
Uses for O & D Survey Data Sets . Household Origin and Destination Surveys help transportation analysts understand people's travel choices: • What trips or tours do people make (origins and destinations) • Why they travel (purposes or activities) • Travel patterns (amounts by household or person characteristics and by places they go) • How travel would change under different circumstances (travel models) These surveys provide the detailed information about the large number of choices travelers make. Those explanations are most usefully expressed in transportation models which in turn allow analysts to estimate travel under changed circumstances, usually alternate land use and transportation system scenarios.
Some Travel Pattern Descriptions • School and Commute distances and modes • Non-driving trips by distance and home region • Reasons for not walking more • Reasons for living where they do • Trip purposes and start and end times • Medical conditions affecting mobility • Use of mobility devices • Internet use: frequency, purchases, delivery
FHWA Contract • In 2008, NHTS invited state DOTs to supplement the sampling in their areas • Caltrans allocated $3.15 million to survey additional households andask additional travel and attitudinal questions about biking and walking • California Original Samples – 3,000 • California Add-On Samples – 18,000 to total - 21,000 (Oversampling in San Diego County to 5,500)
*District 11 (San Diego) has a supplement of 4,600 households
Geographic Designations • National • Region • State • MSA/CMSA/CBSA • County • City • Census Tract/Block • Latitude/Longitude coordinates
Customized Areas – Under Construction Traffic Analysis Zone (TAZ) Air Quality Conformity Regions
Analysis Tools • SAS • MS Access • Statistical Tool on Oakridge Lab website – output is Excel and HTML
Services • Analysis on Request • Consultation • Data Downloads
How to get Data or Analyses NHTS Website: http://nhts.ornl.gov/ California Household Travel Survey (CHTS) http://dot.ca.gov/hq/tsip/otfa/tab/chts_travelsurvey.html Caltrans DOTP Website: www.dot.ca.gov/hq/tsip/otfa Leonard Seitz: Leonard.Seitz@dot.ca.gov (916) 654-2610 Diana Portillo Diana.Portillo@dot.ca.gov (916) 653-3182 Soheila Khoii (CHTS) Soheila.Khoii@dot.ca.gov
Estimating total miles walked and biked by census tract in california Caltrans Planning Horizons Forum December 11, 2013 Deborah Salon, PhD Institute of Transportation Studies University of California, Davis
Motivation • Vehicle activity is an output of travel models, but detailedestimates of bicycle and pedestrian activity are often not available. • Good estimates of the total amount of cyclist and pedestrian activity on our roads are useful for: • Informing demand-based investments in bicycle and pedestrian infrastructure • Identifying dangerous locations for potential road safety investment
Research question • What are the total miles walked by pedestrians and total miles biked by cyclists living in each census tract in California? • Important Note: The estimates presented here are not of miles walked and biked within the geographic area of each tract, but we expect them to be highly correlated with these values.
Method • Assign census tracts to neighborhood types based on built environment characteristics • Calculate miles biked and miles walked for each respondent in the 2009 NHTS and the 2010-2012 CHTS (all results presented are from NHTS) • Assign each survey respondent to their age-gender-home neighborhood category • Calculate average miles biked and miles walked for each age-gender-home neighborhood category • Use these averages with census data to expand travel survey data to population totals
Neighborhood type classification • Cluster analysis of 10 variables yielded 4 neighborhood types: • Population Density • Road Density • Local Job Access • Regional Job Access • Restaurants Within 10 Minute Walk • Pct. Walk/Bike Commuters • Pct. Single Family Detached • Pct. Old Housing • Pct. New Housing • Median House Value