Download
1 / 45
460 likes | 524 Vues
Learn about Marketing Information Systems (MkIS), primary vs. secondary data, advantages and disadvantages, tools, costs, benefits, and more. Gain insights into marketing research methods, analyze data, and make informed decisions.

E N D
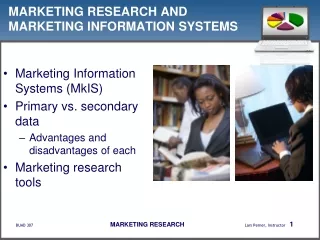
MARKETING RESEARCH AND MARKETING INFORMATION SYSTEMS • Marketing Information Systems (MkIS) • Primary vs. secondary data • Advantages and disadvantages of each • Marketing research tools
Learning Objectives • Appreciate the costs and benefits of research • Appreciate the uses of both primary and secondary market research • Appreciate the respective advantages and disadvantages of different primary research methods • Develop an understanding of research method problems that can lead to misleading or incorrect conclusions. • Understand the proper sequence of research activities.
Marketing Research • An “investment” to reduce uncertainty • Can help guide decisions on • Whether to enter • Product characteristics • Promotional strategy • Positioning • Must weigh costs and benefits of research • Money • Time spent • No perfect method—tradeoffs between methods
Marketing Information Systems (MkIS) • Set of procedures and methods for regular collection and analysis of information for marketing decisions • Databases (internal information—e.g., sales volumes) • Market research • Primary • Secondary
Data Mining • Processing of vast amounts of data to find relationships between variables—e.g., • Items frequently purchased together “strategic adjacencies” (items placed together in retail setting) • Seasonal patterns in sales • Customer segments
Two Research Methods • Secondary: use of existing research already done • Internal • Information System content—e.g., sales/order records • External • Government • Consulting firms • Newspaper and magazine articles • Primary: creation of specific studies to answer specific questions
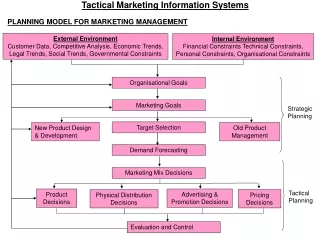
Market Research Sequence Identify problem or opportunity Plan research design and collect data Collect data Text, p. 169 Analyze data Report and present results
Primary Research Methods • Surveys • Experimentation • Observation • Focus groups • In-depth interviews • Projective techniques • Physiological Measures • Online research • Scanner data • Hybrid Methods
Primary Research Methods • Exploratory Methods • Observation (can be more definitive with larger sample sizes and focus on specific behavior) • In-depth interviews • Focus groups • Projective techniques • Precision Methods (“Conclusive”) • Experiments • Surveys • Panel • Scanner data
Surveys • Forms • Mail (self-administered, single time) • Mail panel (self-administered, multiple surveys administered over time) • Telephone (from central location) • Mall Intercept • Computer/Internet • Planned questions • Open-ended • Closed-ended • Need large sample sizes for precise conclusions SURVEY COSTS: USUALLY LOW
Characteristics of Some Problematic Questions • Difficult to answer—respondent may not have knowledge needed • Amounts spent annually on specific product categories may not be known • Sensitive (embarrassing) • Two in one—e.g., “On a scale from 1 to 10, how fast and reliable are Microsoft programs?” • Leading questions—giving the feeling of the “desired” response • “Do you agree that soft drinks with sugar are bad for you?” • Non-exhaustive question • Non-mutually exclusive answers
Continuum Questions • Questions rating the degree of a characteristic (e.g., agreement or product usage) tend to be more effective than binary “Yes/No” questions • E.g., 5 4 3 2 1 Strongly Neither Strongly Agree Agree Agree Nor Disagree Disagree Disagree
Some Areas Suited for Continuum Ratings • Interest • Purchase likelihood • Satisfaction/ Dissatisfaction • Brand loyalty • Price sensitivity • Knowledge • Experience • Involvement • Decision control • Frequency or level of use • Awareness • Information search • Personality traits • Variety seeking
The Pentagon Declares War on Rush Limbaugh: Misleading Research • Survey found that only 4.8% of listeners to the Armed Forces Radio Network wanted to listen to “the biggest hawk there is.” • How could a survey be made to get these results? • Being on the watch for misleading surveys.
Experimentation • Subjects in different groups treated differently • E.g., for some, “target” product is given better shelf space • E.g., some get coupon • Can help isolate causes • Subject is not biased by questions—does not know how others are treated EXPERIMENT COSTS: HIGH
My Simulated Store… A shopper in the everyday low price condition…
Ash’s Instant Coffee Study GROCERY SHOPPING LIST Ground beef Potatoes Apples Flour Sugar Laundry detergent Instant coffee 6 cups of yogurt Paper towels Bananas GROCERY SHOPPING LIST Ground beef Potatoes Apples Flour Sugar Laundry detergent Ground coffee 6 cups of yogurt Paper towels Bananas Respondents were asked to describe their impressions of a housewife based only on her shopping list. These shopping lists differ only on one item.
Definition • Confound: The tendency of some phenomenon to be caused at least in part by some variable other than the one of interest. • E.g., does having more toys cause children to be more intelligent?
Confounds • What is cause, what is effect, and what is coincidence? • Correlation is not necessarily cause • “Lurking” factors may be real cause of • Does sitting in front of the room cause higher grades? • Do vaccinations cause autism? • Does Prozac cause suicide? • Do fish-heavy diets cause stomach cancer? • Does fraternity/sorority membership cause higher grades?
Observation • Looking at consumes in the field—e.g., • Searching for product category area • Number of products inspected and time spent on each • Apparent scrutiny of labels or other information • Involvement of others • Behavior under limiting circumstances (e.g., time constraints) OBSERVATION COSTS: LOW TO HIGH (DEPENDING ON CODING AND ANALYSIS NEEDED)
Taste Tests • Not experiments unless • Two or more groups of people are treated differently (e.g., get different food version) or • The same person is being treated differently at separate times (e.g., half the participants receive new formulation, then current; half the participants receive in the opposite order) • “Triangle” Measure • Each respondent is given three items: One current, one new, and one duplicate of either old or new • Asked to identify the one that is different and explain why
Focus Groups • Groups of 8-12 consumers assembled • Start out talking generally about context of product • Gradually “focus” in on actual product Usually NOT the best approach. Should NOT be chosen as default research method! MOST APPROPRIATE AS EARLY STAGE METHOD FOCUS GROUP COSTS: HIGH (ESPECIALLY FOR THE AMOUNT OF INFORMATION COLLECTED)
REMINDER • Focus groups are most useful for identifying issues that should be studied in more detail with more precise methods • Due to the small sample size and social influence on individual responses, it is difficult to generalize much from focus groups
In-depth interviews • Structured vs. unstructured interviews • Generalizing to other consumers • Biases • Subtle, inadvertent feedback IN-DEPTH INTERVIEW COSTS: HIGH
Projective Techniques • Getting at motivations that may not be consciously known— “Tell a story about this picture.” • Measurement of attitudes consumers are unwilling to express • It is easier to admit something embarrassing about someone else • Consumer discusses what other consumer might think, feel, or do PROJECTIVE METHODS COSTS: USUALLY HIGH IF PERSONAL INTERVIEWS OR EXTENSIVEINTERPRETATION IS NEEDED
Projective Examples “Please tell me a story of what is going on in this picture.”
Physiological Measures • Consumer bodily responses are watched at various phases of advertisement or other marketing exposure • Tracking of • Eye movements • For areas of focus • For attention, involvement • Heart rate • Skin conductivity • Brain waves • State of mind • Attention PHYSIOLOGICAL METHODS COSTS: HIGH
Online Research—Analysis of Customer Search Queries • Unmet demand—search for product not found on site • Message comprehension—comparison of search terms to media message • Consumer vocabulary • Feedback analysis ONLINE SURVEY COSTS: USUALLY LOW
Online Surveys • Conditional branching—direct skip to relevant question • Quality of response • Time pressures • Willingness to write out answers or respond to multiple closed-ended questions • Willingness to read and follow instructions is limited • Reliability and browser compatibility issues
Conditional Branching • Traditional surveys: Have you bought a new car during the last six months? If not, please skip to Question 11. • Conditional branching: Respondent will be taken to the appropriate question according to answer • Customization of questions • E.g., consumer lists three brands subsequent questions ask about these specific brands by name
Other Online Tools • “Click Stream Analysis:” Analysis of “clicking” path—how does the consumer get to a desired page or product? • Shopping cart analysis COSTS: HIGH START-UP COSTS; LOW VARIABLE COSTS POSSIBLE WITH DEVELOPED ALGORITHMS USUALLY LOW COSTS: HIGH START-UP COSTS; LOW VARIABLE COSTS POSSIBLE WITH DEVELOPED ALGORITHMS USUALLY LOW
Searching for Reports of Personal Experience • Sources • Blogs (blogsearch.google.com) • Photos (e.g., Flickr, Webshots, Picasaweb, Google image search) • Video (e.g., Youtube) • Cautions • May be “staged” or sensationalized • May represent what the writer or photographer wants to show • May be limited entries on certain “mundane” tasks such as dishwashing • Some issues • Joy, enjoyment • Decisions • Anxiety • Social setting and influence
Online Market Research Concerns • Representativeness of • Population—are relevant groups reached in desired proportions? • Sample—even if the desired population is reached, do respondents respond in desired proportions? • Willingness of participants to follow instructions • Timing of survey participation requests • Panel recruitment • Privacy
Scanner Data • Panel members in test communities agree to • Swipe a card prior to each purchase • Have purchases matched to • Demographic profiles • Media/coupon exposure • Promotional status of competing brands • Past purchases • Problems: • Aggregation over household • Aggregation bias--averages of disparate segments obscure! • Only available for grocery and some drugstore products COSTS: HIGH START-UP COSTS; LOW VARIABLE COSTS POSSIBLE WITH DEVELOPED ALGORITHMS USUALLY LOW
Scanner Data Research Purchase on occasion: Yes, no Time since previous purchase Previous purchases Current price Previous price Current promotional status Previous promotional status Current display status Previous display status Display status of competing brands Promotional status of competing brands Coupon used: Yes, no Coupon available: Yes, no Coupon available for other brands? Yes, no Amount of coupon No. of ads seen by shopper Ads seen for competing brands “Split cable” RECORDED PURCHASES TELEVISION EXPOSURE HOUSEHOLD FILE DEMOGRAPHIC INFORMATION ANALYSIS Family size Occupation Family size Income Home ownership
Hybrid Studies • Some studies do not fall neatly into one category or may consist of a combination • E.g., a series of questionnaires in which respondents are given different information/ presentations becomes an experiment
Research Sequencing • More than one research method may be needed • Exploratory studies—e.g., focus groups—should be done BEFORE precision approaches such as surveys. • “Parallel:” Studies can be done at the same time if needed • E.g., need to know both attitude toward brand (questionnaire) and brand switching propensity (scanner data) • Follow-up: One study is needed to address issues raised in a previous one
Follow-Up Studies • Normally, more general methods (e.g., focus groups) should be used first • E.g., identify issues of concern • Subsequent studies can use more precise, less flexible methods • E.g., questionnaire, scanner data, physiological measures, or experiments to follow up on issues raised in early focus group
REMINDER • If focus groups should be used at all, they should usually be used EARLY in the research process—NOT after more precise methods are used.