Download
1 / 19
190 likes | 444 Vues
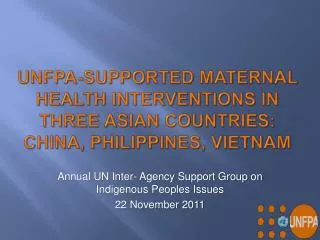
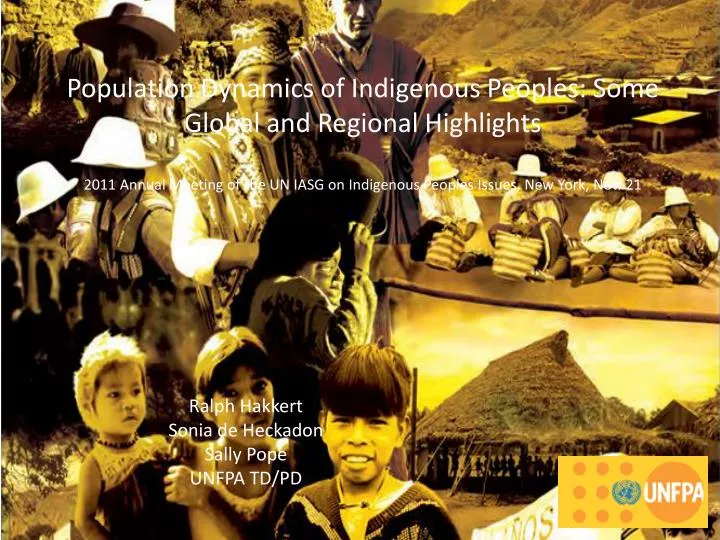
Population Dynamics of Indigenous Peoples: Some Global and Regional Highlights 2011 Annual Meeting of the UN IASG on Indigenous Peoples Issues, New York, Nov. 21. Ralph Hakkert Sonia de Heckadon Sally Pope UNFPA TD/PD. Reasons why statistics on indigenous peoples are deficient.

E N D
Population Dynamics of Indigenous Peoples: Some Global and Regional Highlights2011 Annual Meeting of the UN IASG on Indigenous Peoples Issues, New York, Nov. 21 Ralph Hakkert Sonia de Heckadon Sally Pope UNFPA TD/PD
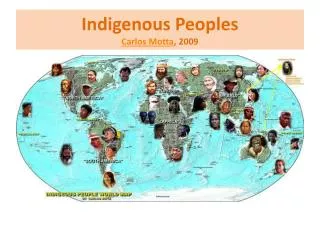
Reasons why statistics on indigenous peoples are deficient There are many interpretations about what it means to be defined as indigenous peoples. Estimates of their numbers worldwide vary between 300 and 370 million (5,000 groups in 70-90 countries). In many countries (e.g. China), the concept of indigenous peoples is not clearly separated from other kinds of minorities. More than half of the world’s people recognized as indigenous live in four countries where statistics on their situation are hard to obtain: China, India, Indonesia and Myanmar. The countries that keep (relatively) good statistics on indigenous peoples (USA, Canada, Australia) account for only slightly more than 4 of the 300 or 370 million. But even in Australia, the authorities admit that vital statistics on indigenous peoples are not reliable.
Reasons why statistics on indigenous peoples are deficient (2) In many countries (especially in Africa) governments are reluctant to compute statistics on ethnic groups, for fear of their political implications. In many countries, indigenous peoples make up less than 1% of the population, making it difficult to separate some statistics (e.g. maternal mortality). Some statistics (e.g. on poverty) are based on concepts that have little meaning within some indigenous cultures (e.g. hunters and gatherers). Some statistics (e.g. on fertility or landholding) are politically sensitive and it is not necessarily in the perceived interest of the indigenous communities to help to collect them.
Indigenous peoples worldwide China 108 million India 68 million Indonesia 30-40 million Myanmar 16 million Viet Nam 12.5 million Philippines 9.4 million Nepal 8.4 million Total Asia: 207 million (or > 252.3) Morocco 9.1-21.7 million Kenya 11 million Algeria 10 million Other Africa 19 million Total Africa: 50 million Mexico 13.4 million Bolivia 6.5 million Guatemala 6 million Peru 4.1 million Colombia 1.4 million Other Latin Am. 8.6 million Total Latin America: 40 million USA 2.4 million Canada 1.2 million Australia 0.5 million
Poverty statistics It is said that indigenous peoples, which make up 4.25-5.25% of the world population, constitute 15% of the world’s poor and a third of the world’s rural population living in extreme poverty. This is based on the assumptions that: • All individuals belonging to indigenous peoples live in extreme poverty; and • All indigenous peoples live in rural areas. The main problem with this is that, while the World Bank criterion of (extreme) poverty may make sense for more advanced agrarian societies (e.g. the Mayas in Central America), it cannot be meaningfully applied to hunter-gatherer societies (e.g. the San of Southern Africa) or even to nomadic societies (e.g. the Touareg of Northern Africa).
Geographical criteria Some statistics, such as the ones on maternal mortality, are difficult to obtain for small populations. Even if they can be obtained, this is not always done. Sometimes a geographical criterion is substituted, as a proxy for a strict ethnic criterion. For example, it is said that maternal mortality for indigenous groups in Honduras (1990-1997) was 190-255 per 100,000 births, compared to 147 for the general population. However, the 190-255 range actually applies to 5 Departments (Colón, Copán, Intibucá, Lempira and La Paz) where the percentage of indigenous populations is relatively high. The limitations of this approach are: • Many of the inhabitants of these Departments are not indigenous. • Major pockets of indigenous populations also exist in Atlántida and Cortés, where average health conditions are much more favorable.
Education • Rates of illiteracy higher among IPs than any other group Educational outcomes are worse for indigenous compared to non-indigenous. There is an overall lack of support for bilingual, intercultural education. Obstacles to accessing good education includeNomadic lifestyle, isolation violence, discrimination, exclusion, extreme poverty. Primary school outcomes among the Batwa in the DRC is 11% compared to the 72% national rate; the Batwa illiteracy rate is 94% vs. 20-53% nationally. In Rwanda, Uganda and Burundi, the Batwa are considered mentally retarded and the great majority do not attend school.
Life expectancy Improvement of indigenous life expectancy in Australia and Canada has been less pronounced than improvement in infant mortality. In Australia, life expectancies for indigenous people in 1981 were around 56 years for males and 64 years for females, some 20 years below those of the general population. This situation had not altered by 2000. In Canada the equivalent gap in life expectancy in the 1990s was eight years despite a steady improvement in indigenous mortality since the 1950s. In both countries the overall level of indigenous mortality reflects persistently higher indigenous death rates at all ages but especially between ages 30 and 50. This lack of improvement relative to the life expectancy of the general population despite lowered infant mortality reflects the influence of lifestyle factors as a primary cause of death among marginalized populations.
Birth rates / Fertility The vast majority of indigenous communities have higher birth rates than the general population. There are few exceptions. For example, the extremely low birthrates of the Ainu in Japan are contributing to their disappearance as a separate ethnic group. Birth rates among the Native American communities in the USA have declined considerably during the past 50 years and are now similar to those of non-Hispanic whites. Teenage fertility is still higher among Native Americans, although not as high as among Afro-Americans and Hispanics. High birth rates may not be intrinsically tied to indigenous status. In some cases, indigenous populations have fertility levels that are very similar to non-indigenous rural populations with the same levels of education and income.
Birth rates / Fertility (2) Total Fertility Rates among indigenous women in Australia peaked in 1956–1966, remained high until 1971, and then fell sharply throughout the 1970s, from around 5.9 in the period 1966–1971 to around 3.3 in the period 1976–1981 and 2.7 in the mid-1990s. The expectation is for steady progress toward replacement fertility in the early decades of the 21st century. The explanation is increased participation by indigenous people, particularly women, in mainstream institutional structures, which has altered the costs and benefits of having children. In particular: 1) Age at leaving school; 2) Labor force status; and 3) Income. In Canada fertility has also been lowered by delayed marriage and childbirth. As a consequence of the gap between fertility and mortality, indigenous populations in Australia and Canada grew rapidly (2-2.5% per year) during the 1970s and 1980s.
Maternal mortality Despite methodological limitations, the higher maternal mortality rates among indigenous women are a fairly consistent finding. Infrastructure Barriers Poor roads and physical structures, i.e. health facilities, contribute to morality rates Maternal mortality among indigenous women in Guatemala is 83% higher than among the general population. Maternal mortality among indigenous women in Australia (2003-2005) was 21.5 per 100,000 births, compared to 7.9 for the general population. Data on maternal mortality rates among indigenous women are very scarce, with indigenous women often not being distinguished from minorities in reports.
Reproductive Health / Voluntary Family Planning Although data on Reproductive Health and Voluntary Family Planning are far from complete, there is nevertheless evidence of lower rates of usage among indigenous women. In Guatemala, only 40% of indigenous women use contraceptive methods, compared to 60% of the general population. In Viet Nam, 60% of indigenous women do not receive prenatal care, compared to 30% of the general population. Low birth weight affects 12.4% of indigenous births in Australia (2006), compared to 6.2% of births among non-indigenous.
Child health / mortality Scattered evidence indicates higher infant and child mortality and poorer child health indicators among indigenous populations. For example, Child mortality is 70% higher among indigenous populations in Latin America; Under 5 mortality among the Babendjelle of the DRC is 270 per 1,000, compared to 180 in neighboring Bantu villages; Child mortality in the indigenous Ratanakiri Province of Cambodia is 187 per 1,000, compared to a national average of 95; Infant mortality among indigenous children in Panama is more than 3 times as high (60-85 per 1,000 births) as the national average (17.6). Infant mortality for Australian indigenous peoples fell considerably, from about 100 in the 1960s to 26 by 1981. In Canada, it fell from 42 to 15 between 1971 and 1988. But in both cases these figures were still above the corresponding IMR for the general populations.
STIs and HIV/AIDS Overall, there is a serious lack of reliable data on STIs and HIV/AIDS among indigenous populations. However, it is believed that indigenous women are particularly vulnerable to HIV/AIDS and that economic and social exploitation, in addition to lack of health education, further contributes to this trend. Key factors to the impact of HIV and AIDS on indigenous populations include poverty, marginalization, different understanding of medicine and health, geographical isolation, relationship to land, different demographics and low level of participation in political and policymaking processes.
Migration and Urbanization:A growing trend Voluntary Involuntary Environmental degradation destroys livelihoods Dispossession Armed conflict Natural disasters Poor legal protection of land/ resources Poverty Better economic opportunities Closer to social services Educational opportunities Closer to health services
Migration and Urbanization:Environmental degradation and Military Conflict Environmental Degradation In Uganda, 30 000 indigenous peoples were forced to leave to create a wildlife corridor; Armed Conflict Between 2004-2007, 30 000 indigenous peoples in Colombia were forcibly displced because of armed conflict. In 2009, the Colombian Constitutional Court stated that they feared the cultural or physical extermination of 34 indigenous groups and had suffered sever individual and collective rights violations due to armed conflict. Between 1998-2008, 1 980 indigenous deaths were linked to armed conflict.
Limitations Given all the circumstances listed in the previous slides, this presentation has the following limitations: • It focuses on concrete examples for which some data are available, but it cannot project a representative statistical picture at the global or even the regional level; • The presentation is biased towards those cases for which the best data are available: Australian, North American and to a lesser extent Latin American indigenous populations, with very few examples from Asia or Africa; • The presentation can identify some trends and tendencies, but cannot do justice to the variety of situations of distinct indigenous populations.
Conclusionsand Recommendations Despite the aforementioned limitations on data of indigenous peoples, it is widely recognized that they suffer more than majority populations worldwide from human rights violations, worse health outcomes, discrimination and marginalization. More national and regional data (i.e. population size, maternal mortality rates, etc.) on indigenous peoples MUST be collected worldwide, especially in countries and regions where data is scarce and indigenous people may not be formally recognized by governments. Governments that do not do so already, must be pressured to formally recognize national indigenous populations and protect their rights.