Download
1 / 30
300 likes | 547 Vues
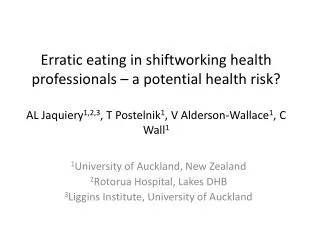
What use is made of acute hospital beds from aged care residents in Auckland, New Zealand? . Joanna Broad, Michal Boyd, Martin Connolly Freemasons’ Department of Geriatric Medicine University of Auckland, Auckland, New Zealand. RNZCGP Annual Conference, Auckland, September 2011.

E N D
What use is made of acute hospital beds from aged care residentsin Auckland, New Zealand? Joanna Broad, Michal Boyd, Martin Connolly Freemasons’ Department of Geriatric Medicine University of Auckland, Auckland, New Zealand RNZCGP Annual Conference, Auckland, September 2011
Residential aged care (RAC) in New Zealand RAC for older people in New Zealand is classified by Health and Disability Services (Safety) Act 2001 as: • private hospital care - for those who need 24-hour nursing or medical care • rest home care - for those who are frail or need support, but not 24-hour nursing or medical services Residential aged care in NZ is used by over 40% of those aged 65+ before death
Interest in hospitalisations by those living in RAC - why? Concerns that population ageing will drive large increases in demand for hospital care, from people in communities and in RAC Anecdotal reports of concern for numbers of hospital beds occupied by people from RAC, with hospital services stretched because of RAC residents 2010 projections show demand for RAC beds will rise78 – 110 %by 2026Grant Thornton 2010 RAC residents admitted can become disoriented, suffer adverse events, declines in function and long-term outcome Evidence that improved care is possible within the facilities themselves
What is “known” of hospital use by those in RAC ? Compared with people living in the community, RAC residents showed higher risk of hospitalisation (RR=1.39), injury (2.68), #NoF (3.96), death in hospital (2.58)Godden 2001 LTC residents (vs home-based care, & home in community) received less inpatient care, less ambulatory care, more physician care Wilson 2006 In Western Australia, 30+ transfers to ED per 100 RAC beds per year. 40+% not admittedArendts 2010 23% of costs of hospitalisations from RAC are potentially avoidableGrabowski 2007 ?
What is known of hospitalisations by those in RAC in NZ? Our national hospitalisation records do not usually record where people live or arrive from Available data about where they go when discharged is regarded as unreliable no good evidence about use of acute care from RAC ? But, we had OPAL survey data for a full cohort of residents at one point in time Broad 2011, Boyd 2011 Could track residents over time using NHI numbers ? Could provide useful hospitalisation information
Question: What use is made of acute hospital beds by people living in RAC settings? Briefly, complete survey of all facilities licensed to provide residential aged care in Auckland region, incl. NHI number Mortality & hospitalisations information from NZHIS, using NHI numbers to identify residents Can select those for acute unplanned admissions During analyses, can weight resident records to represent a one-year profile of residents within each facility, to provide population-wide view Full ethics approval
Method: OPAL survey of facilities licensed to provide RAC in Auckland Survey in September 2008 using same items as in 3 previous surveys over 20-year period included people living in rest homes, public & private long-stay hospitals (independent living units & retirement villages were not included) all facilities in wider Auckland region (3 DHBs) resident information recorded – demographic, stay information, care level, functional dependency, NHI number (no names)
Method: NHI hospitalisation data merged hospitalisation data with survey data hospitalisations information from NZHIS used NHI numbers to identify residents checked age & gender matched details include dates of all admissions & discharges, all recorded discharge diagnoses & procedures, & DRGs retained only acute unplanned admissions “joined” transfers into single sequence, used DRG code of first in sequence selected records of completed overnight hospital stays where date of admissions was before 10Sept09 during analyses, weighted to represent resident population over 12 months
Cohort information • 152 of 172 facilities (88%) OPAL participation • 6,839 forms (90%), representing 7,601 residents • 6,255 (91%) were matched (some no NHI #s) Survey Population No. facilities 152 172 No. beds 8,719 8,816 No. residents 6,839 7,601 Matched with NHI 6,255-
Mortality in 12m:No. deaths 1,594 No. in-hospital deaths 306 Completed admissions - acute, unplanned: No. residents admitted 1,166 No. hospital admissions during 12m 1,549(9% “joined” from a sequence of stays) No. hospital bed-days (incl. after 12m) 17,181 Outcomes in 6,255 residents matched, during 12 months post-OPAL
Residents, admissions & bed-days of population of RAC residents in Auckland, Sep08-Sep09 N residentsAdmissions Bed-days OPAL cohort with MoH matching 6,2551,549 15,138 Est. OPAL cohort -inflated for non-matched 6,829 1,689 16,505 Est. RAC population -inflated for non-response 7,592 1,890 18,362 Est. thru RAC during 12 month period 9,057 2,165 20,543
Estimated admissions in population of RAC residents in Auckland, Sep08-Sep09 Counts Residents in region 9,057 Residents with 1+ admits 1,658 (18%) Admissions 2,165 mean Totals per stay Bed-days in 12m 20,543 9.5 Cost-weights 4,272 2.0 Note: sequential stays are combined into a single stay, so are not comparable with usual data
Admissions for selected DRGs in population of RAC residents in Auckland, Sep08-Sep09 *N % bed-days % Respiratory infection 161 7 1,018 5 Hip & femur 125 6 2,393 12 Heart failure 121 6 1,152 6 Kidney & UTI 120 6 913 4 Stroke 71 3 806 4 Gastro-intestinal 66 3 581 3 COPD 65 3 971 5 Dementia 37 2 1,385 7 Rehabilitation 36 2 871 4 Mental disorders 14 1 648 3 * Note: Top 10 DRGs are here selected & sorted by number of admissions
Admissions for selected DRGs in population of RAC residents in Auckland, Sep08-Sep09 admission rate *mean mean per 1000 person-years LOS cost-wt Mental disorders 1.9 48 13.6 Dementia 5.1 38 4.9 Rehabilitation 5.0 24 3.5 Hip & femur 17.4 19 5.4 COPD 9.0 15 2.8 Stroke 9.8 11 2.3 Heart failure 16.7 10 1.6 Kidney & UTI 16.6 8 1.4 Respiratory infection 22.2 6 1.4 Circulatory 10.8 5 1.3 * Note: Top 10 DRGs are here selected & sorted by length of stay
Most expensive conditions, circles represent sum of cost-weights
Strengths Prospective cohort Clear time points Good response rate Good matching rate Outcomes measured independently using routinely collected data, so study bias does not arise Weaknesses Use of weighting to adjust for missing data assumes that those missed, or not matched, are similar to others Most data shown are estimates for the 12-month period, yet confidence intervals not calculated Potential exists for some admissions to be grouped with others to make larger DRG groups
Where does this lead? For the year Sept 2008-09, in Auckland an estimated 9,000 RAC residents ~2,200 acute hospital stays, ~ 6 per day 30 admits per 100 occupied beds per year 20,500 bed-days over the year ? • A reduction in admissions from RAC of • 10% could lead to ~2,050 bed-days saved pa • 15% could lead to ~3,000 bed-days saved pa • Most costly acute conditions include hip & femur, respiratory infections, heart failure, mental disorders, COPD, dementia, kidney & UTI, & stroke
Evidence that hospitalisations from RAC can be reduced through… • multi-disciplinary team, integrated care approach Philiips 2000, Joseph 1998 • more skilled facility staff (assessment & early recognition) Konetza 2008, Kane 2003, Ouslander 2010, Szczepura 2008 • co-ordination of care by e.g. nurse practitioners Kane 2003 • better assessment of acute or sub-acute changes in condition Rantz 2004 • ability to obtain diagnostic tests & administer intravenous fluids Loeb 2006 • advanced care planning Kaplan 2006 • medication reviews Szczepura 2008 have been shown to reduce hospitalisations without negatively impacting resident care
Ambulatory sensitive admissions (ASH) i.e. potentially avoidable admissions • Usual definitions of ASH exclude those aged over 75yrs • Definitions typically include: • congestive heart failure • pneumonia & respiratory infections • kidney & urinary tract infections • circulatory conditions including MI, stroke, IHD • fall or fracture • diabetes, nutrients & anemia, constipation • To which we add: • skin tears, leg ulcer, cellulitis • dementia, depression • syncope, collapse, hypotension • dehydration, volume depletion & others
Aged Residential Care Hospital Utilisation Study (ARCHUS) – an RCT • cluster randomised trial currently underway • complex package of supports & education to facility staff: • initial stock-take assessment of care, incl. benchmarking • provision of targeted education to facility nurses & caregivers • multi-disciplinary team meetings including GP • ongoing access to specialist physician & nurse • clinical coaching for high-risk residents • aim to reduce ASH admissions without negatively impacting residents’ care
Aged Residential Care Hospital Utilisation Study (ARCHUS) – in progress 36 RAC facilities in Auckland region using staff of 3 DHBs recruitment complete, intervention complete April 2012, follow-up until November 2012, results 2013 economic evaluation planned feedback study of implementation planned See poster for more information
Summary • when weighted to represent the RAC population in Auckland, ~6 acute hospital admissions per day (not including ED presentations which did not lead to overnight admission) • 30 admissions per 100 occupied beds in this cohort in 12-month period (Sept 2008-Sep2009) • if this could be reduced by say 15%, ~46bed-days per month would be made available • efforts to reduce admissions from RAC could focus on improving earlier recognition & improved care within facilities for any of the following: • hip & femur, respiratory infections, heart failure, mental disorders, COPD, dementia, kidney & UTI, & stroke
Acknowledgements The staff and managers of the facilities who completed forms. Health Care Providers & the Association of Residential Care Homes, for support. Funding 2008-09 Freemasons Roskill Foundation 2010-11 Health Research Council of NZ.
Mortality in cohort 6mths 12mths 22mths Overall 14% 25% 40% Men 15% 28% 43% Women 13% 24% 39% Aged under 65 yrs 6% 11% 16% 65-74 yrs 9% 18% 27% 75-84 yrs 12% 24% 37% 85-94 yrs 16% 28% 44% 95+ yrs 17% 36% 56% Care type Rest home 8% 18% 32% Dementia 10% 23% 32% Other eg short stay 14% 19% 27% Psycho-geriatric 17% 24% 33% Private hospital 21% 35% 52%
Trends in Mobility (p=<0.0001, decreased mobility over time)
Trends in Urinary continence (p=<0.0001, increased urinary incontinence over time)
Trends in Memory (p=<0.0001, increased problems with memory over time)