Understanding Demand and Tax Incidence in the Frozen Pizza Market
This analysis dives into the demand curve for frozen pizza, illustrating the relationship between price, consumer surplus, and marginal utility. It details how consumer demand shifts with price changes and highlights the impact of taxes on supply and demand. Through practical examples, it explains how taxes affect the market equilibrium for used cars and gasoline, portraying the incidence of taxes on buyers and sellers. It also discusses the implications of government price controls as an implicit tax and subsidy, emphasizing how these policies can create shortages and transfer surpluses.

Understanding Demand and Tax Incidence in the Frozen Pizza Market
E N D
Presentation Transcript
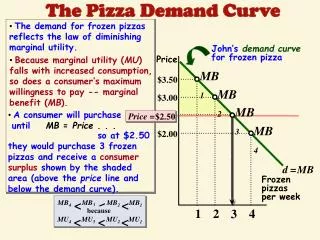
John’sdemand curvefor frozen pizza MB1 MB2 MB3 Price = $2.50 MB4 d = MB < < < MB4 MB3 MB2 MB1 because < < < MU4 MU3 MU2 MU1 The Pizza Demand Curve • The demand for frozen pizzas reflects the law of diminishing marginal utility. • Because marginal utility (MU) falls with increased consumption, so does a consumer’s maximum willingness to pay -- marginal benefit (MB). Price $3.50 $3.00 • A consumer will purchase • untilMB = Price . . . $2.50 $2.00 so at $2.50 they would purchase 3 frozen pizzas and receive a consumer surplus shown by the shaded area (above the price line and below the demand curve). Frozen pizzasper week 1 2 4 3
Consumer Surplus The total difference between what a consumer is willing to pay and how much they actually have to pay. Producer Surplus The total difference between what a supplier is willing to provide a good or service and how much they actually get for it.
Producer and Consumer Surplus P Consumer surplus = area of red triangle = ½($5)(5) = $12.5 $10 9 8 7 6 5 4 3 2 1 S Producer surplus = area of green triangle = ½($5)(5) = $12.5 CS PS The combination of producer and consumer surplus is maximized at market equilibrium D Q 0 1 2 3 4 5 6 7 8 8-3
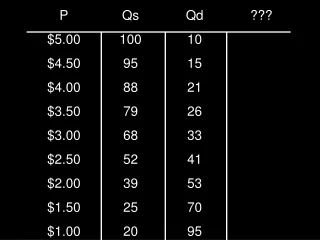
Consumer Surplus • Price Quantity • 1 • 2 • 3 • 4 • 5 • If the selling price is 3, the consumer surplus for the 1st item is 5-3=2, plus 4-3=1 for the 2nd and 3-3=0 for the 3rd, or 3
The Burden of a Tax Tax Incidence • Who pays a tax is called the incidence. Buyer Seller
Splus tax $1000 tax Impact of a Tax Imposed on Sellers Price • If in the used car market a price of $7,000 would bring the quantity of used cars demanded into balance with the quantity supplied. S • When a $1,000 tax is imposed on sellers of used cars, the supply curve shifts vertically by the amount of the tax. $7,400 $7,000 • The new price for used cars is $7,400 … sellers netting $6,400 ($7,400 - $1000 tax). $6,400 D • Consumers end up paying $7,400 instead of $7,000 and bear $400 of the tax burden. • Sellers end up receiving $6,400 (after taxes) instead of $7000 and bear $600 of the tax burden. # of used carsper month(in thousands) 500 750
$1000 tax Dminus tax Impact of a Tax Imposed on Buyers Price • In the same used car market: • When a $1,000 tax is imposed on buyers of used cars, the demand curve shifts vertically by the amount of the tax. S $7,400 $7,000 • The new price for used cars is $6,400 … buyers then pay taxes of $1000 making the total $7,400. $6,400 • Consumers end up paying $7,400 (after taxes) instead of $7,000 and bear $400 of the tax burden. D • Sellers end up receiving $6,400 instead of $7000 and bear $600 of the tax burden. # of used carsper month(in thousands) 500 750
The actual burden of a tax depends on the elasticity of supply and demand. Elasticity and Incidence of a Tax • As supply becomes more inelastic, then more of the burden will fall on sellers. • As demand becomes more inelastic, then more of the burden will fall on buyers. ED ES ED + ES ED + ES
S plus tax S plus tax Tax Burden and Elasticity • Consider the market for Gasolineand Luxury Boatsindividually. Price Gasolinemarket $1.65 • We begin in equilibrium. S $1.60 • If we impose a $.20 tax on gasoline suppliers, the supply curve moves vertically the amount of the tax. Price goes up $.15 and output falls by 6 million gallons per week. $1.55 $1.50 $1.45 D Quantity(millions of gallons) • If we impose a $25K tax on Luxury Boat suppliers, the supply curve moves vertically the amount of the tax. Price goes up by $5K and output falls by 5 thousand units. 194 200 Price(thousand $) Luxury boatmarket S 110 • In the gasmarket, the demand isrelatively more inelasticthan its supply; hence, buyers bear a larger share of the burden of the tax. 100 90 D • In the luxury boatsmarket, thesupply curve is relatively more inelasticthan its demand; hence, sellers bear a larger share of the tax burden. 80 Quantity(thousands of boats) 5 10 15 20
Government Intervention as Implicit Taxation • Government intervention in the form of price controls can be viewed as a combination tax and subsidy
An effective price ceiling is a government set price below the market equilibrium price • It acts as an implicit tax on producers and an implicit subsidy to consumers that causes a welfare loss identical to the loss from taxation P A price ceiling transfers surplus from producers to consumers, generates deadweight loss, and reduces equilibrium quantity S P0 P1 Price ceiling Shortage D Q Q1 Q0
An effective price floor is a government set price above the market equilibrium • It acts as a tax on consumers and a subsidy for producers that transfers consumer surplus to producers P S Surplus P1 Price floor P0 A price floor transfers surplus from consumers to producers, generates deadweight loss, and reduces equilibrium quantity D Q Q1 Q0
The Difference Between Taxes and Price Controls • Price ceilings create shortages and taxes do not • Taxes leave people free to choose how much to supply and consume as long as they pay the tax • Shortages may also create black markets
Rent Seeking, Politics, and Elasticities • The possibility of transferring surplus from one set of individuals to another causes people to spend time and resources on doing so. • Lobbying for price controls, which transfer surplus from one group to another, is an example of rent-seeking behavior • Individuals spend money and use resources to lobby governments to institute policies that increase their own surplus • Public choice economists argue that when all rent seeking and tax consequences are netted out, there is often not a net gain to the public
Inelastic Demand and Incentives to Restrict Supply Revenue gained P When demand is relatively inelastic, suppliers have incentive to restrict quantity to increase total revenue S1 S0 P1 C P0 Revenue lost A B D Q Q1 Q0
Inelastic Supplies and Incentives to Restrict Prices • When supply is inelastic, consumers have incentives to restrict prices • When supply is inelastic and demand increases, prices increase causing consumers to lobby for price controls • Rent control in New York City is an example
Application: Price Floors and Elasticity The surplus created by a price floor is larger if demand and supply are elastic P P S Surplus Surplus S Price floor P1 P1 P0 P0 D D Q Q Q1 Q0 Q1 Q0
Long-Run and Short-Run Effects on Price Control P Higher long-run elasticity of supply results in smaller price increases when demand increases Sshort-run PSR Slong-run PLR P0 D1 D0 Q Q0 QSR QLR