I. Statistical Tests:
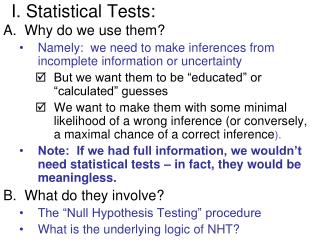
I. Statistical Tests:. Why do we use them? Namely: we need to make inferences from incomplete information or uncertainty But we want them to be “educated” or “calculated” guesses

I. Statistical Tests:
E N D
Presentation Transcript
I. Statistical Tests: Why do we use them? Namely: we need to make inferences from incomplete information or uncertainty But we want them to be “educated” or “calculated” guesses We want to make them with some minimal likelihood of a wrong inference (or conversely, a maximal chance of a correct inference). Note: If we had full information, we wouldn’t need statistical tests – in fact, they would be meaningless. What do they involve? The “Null Hypothesis Testing” procedure What is the underlying logic of NHT?
I. Statistical Tests: (cont.) What do they involve? The basic logic of testing a “null hypothesis”? Testing our research hypothesis against a null hypothesis (any differences found = sampling error) Compare sample value against value specified by Null-Hypothesis (considering sampling variability) Are the difference so large that it is unlikely to be sampling error (considering sampling variability)? The form of the research hypothesis determines the “directionality” of the test Non-directional hypothesis = 2-tailed test Directional hypothesis = 1-tailed test 2-tailed test = more conservative 1-tailed test = more likely to find significant result
I. Statistical Tests: (cont.) • What makes a test result turn out “statistically significant”? • Magnitude of the effect or difference • Amount of variability in data • Sample size • Probability level selected (“alpha level”) • Directional vs. non-directional test • Number of total tests performed
II. How to do Statistical Tests? 3 Basic Tasks: Testing hypotheses about: 1 mean (or 1 sample) 2 means (or 2 samples) 3 or more means (or samples) One Sample tests Testing a sample statistic against a hypothetical value Relevant when we have a specific prediction about the mean(rarely) This is the simplest form of statistical test Use a Z or t test here (whichever is relevant)
II. How to do Statistical Tests? (cont.) Two Sample tests Test difference between two means or groups (against Null-H that they are equal) Difference between 2 independent means Compare 2 separate groups on 1 variable Difference between 2 correlated or paired means (also: “matched groups” or “repeated measures”) Compare 2 variables on 1 group Use Z-test when population variance is known Use t-test when population variance is unknown and must be estimated from the sample What are the assumptions of these tests?
II. How to do Statistical Tests? (cont.) Tests with 3 or groups (& means)? Why not calculate multiple pair-wise tests? Can become unwieldy if we have no specific predictions about the pattern Overall error rate increases rapidly as the number of tests increases Note: per-test vs overallerror rates The Solution = Use an overall statistical test of differences among multiple (2 or more) groups This is called “Analysis Of Variance” (or commonly called ANOVA)
III. What is ANOVA? Similar in logic to t-test comparison of two means except that we use squared deviations rather than simple differences Derive two independent estimates of the population variance for the scores One based on the variations among the group means (between-group estimate) One based on the variations among scores in each of the groups (within-group estimates) (pooled) Each group is taken as a random sample from the same population (under the null hypothesis)
C. What is ANOVA? (cont.) Compare the two separate variance estimates (between-group vs. within-group) Compute a ratio of the two estimates: (between means) / (within groups) If the variation in the group means is larger than the variations within the separate groups, then the groups are really different (i.e., they are not from the same population) Use a statistic that is computed as the ratio of two variances called the F statistic has a calculated probability distribution
C. What is ANOVA? (cont.) F = (Variance of Means)/(Variance of scores) F-distribution depends on two parameters: These represent the “degrees of freedom” in the two different variance estimates in the ratio df1 = degrees of freedom in numerator (group means) k - 1 df2 = degrees of freedom in individual scores N - k
C. What is ANOVA? (cont.) The logic of the F-test? If the F-ratiois much larger than 1.0, which means much larger differences between group means than expected from random sampling errors Then we reject the null hypothesis of equality of means This decision is based on the probability distribution of the F-statistic so that Type 1 error is .05 or less. The null hypothesis and the alternative hypothesis of the ANOVA F-test? H0: Hr: (for at least 2 groups)
C. What is ANOVA? (cont.) What does the F-test tell us? The F-test is a non-directional, omnibus test The F-test doesn’t tell us which two means are different or in what direction It simply affirms that we can say that “at least 2 group means are different” (with a .95 confidence level) What if we want to be more specific? Can use inspection-by-eyeball method Can use post-hoc comparisons (or contrasts)
C. The Logic of ANOVA (continued) “Post Hoc Comparisons” identify which pairs of means are significantly different, while Control overall error rate of the whole set of comparisons Adjust each individual pairwise comparison to keep the overall error rate at desired level (e.g., .05) Which “post hoc comparison” procedure to use? Many different procedures (and frameworks) have been developed and are available in SPSS In this class, select only one: Tukey’s HSD procedure (in SPSS, is simply labeled Tukey)