
Developing a Data Model
E N D
Presentation Transcript
Developing a Data Model Abdulla Gozalov UNSD
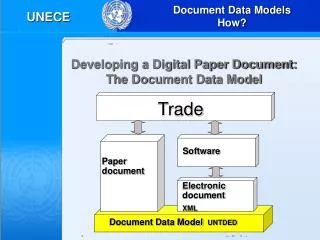
Figures vs Data • Figures by themselves are meaningless. • For data to be usable, it must be properly described. The descriptions let users know what the data actually represent.
Developing a Data Model for SDMX Exchange • In some aspects similar to a developing a relational database • In SDMX, data model is represented by a Data Structure Definition. • The “shape” of SDMX DSD is roughly similar to star schema. • To design a DSD, we first need to find concepts that identify and describe our data.
Concept • “A unit of knowledge created by a unique combination of characteristics”* • Each concept describes something about the data. • Concepts should express all relevant data characteristics. * Source: Metadata Common Vocabulary
Identifying Concepts Indicator Unit Multiplier Period Ref. Area Obs. Value
Dimension • Which of the concepts are used to identify an observation? • Indicator • Reference area • Period • When all 3 are known, we can unambiguously locate an observation in the table. • In SDMX such concepts are called dimensions. • A dimension is similar in meaning to a database table’s primary key field.
Primary Measure • Observation Value represents a concept that describes the actual values being transmitted. • In SDMX, such a concept is called Primary Measure. • Primary Measure is usually represented by concept OBS_VALUE.
Attribute • In our example, Unit Multiplier represents additional information about observations. • This concept is not used to identify a series or observation. • Such concepts in SDMX are called attributes. • Not to be confused with XML attributes! • Similar to a database table’s non-primary key fields.
Dimension or Attribute? • Choosing the role of a concept has profound implications on the structure of data. • Concepts that identify data, should be made dimensions. Concepts that provide additional information about data, should be made attributes. • If a concept is a dimension, it is possible to have time series that are different only in the value of this concept. • E.g. if Unit of Measure is a dimension, it is possible to have separate series for “T” and “T/HA” or, more controversially, “KG” and “T”
Special Dimensions • TIME dimension provides observation time. If a DSD describes time series data, it must have one TIME dimension. • FREQUENCY dimension describes interval between observations. If there is a TIME dimension, one other dimension must be marked as FREQUENCY dimension.
Exercise 1: Identifying concepts • Identify concepts in the table • Mark each concept as: • Dimension • Time Dimension • Primary Measure • Attribute
Representation • When data are transferred, its descriptor concepts must have valid values. • A concept can be • Coded • Un-coded with format • Un-coded free text
Code • “A language-independent set of letters, numbers or symbols that represent a concept whose meaning is described in a natural language.” • A sequence of characters that can be associated with a descriptions in any number of languages. • Descriptions can be updated without disrupting mappings or other components of data exchange.
Code List • “A predefined list from which some statistical coded concepts take their values.” • A code list is a collection of codes maintained as a unit. • A code list enumerates all possible values for a concept or set of concepts • Sex code list • Country code list • Indicator code list, etc
Un-coded Concepts • Can be free-text: Any valid text can be used as a value for the concept. • Footnote • Can have their format specified • Postal code: 5 digits
Representation of concepts in SDMX • Dimensions must be either coded or have their format specified. • Free text is not allowed. • Attributes can be coded or un-coded; format may optionally be specified.
Exercise 2: Representation • Working with your model, determine representation for each concept • Coded, formatted, free-text • Develop code lists and formats for your concepts • Use any approach for your codes
Importance of Data Model • Data model, represented by DSD, defines what data can be encoded and transmitted. • Flaws in a DSD may have significant adverse impact on data exchange • Missing concepts • Incorrect role of concepts • Un-optimized model
Data Structure Definition: Design Considerations • Parsimony • No redundant dimensions • Attributes attached at the highest possible level • Simplicity • “Mixed dimensions” are used to minimize the number of dimensions • Can help avoid invalid combinations of key values • Should be used with caution • Opposite of “purity” Source: Guidelines for the Design of SDMX Data Structure Definitions
Data Structure Definition: Design Considerations (2) • Unambiguousness • Data must retain meaning outside usual context • Do you supply country code with your data? • Density • Model should be such that data could be supplied for most or all of possible combinations of key values • Related to simplicity • Orthogonality • Meaning of the value of concepts should be independent of each other • Helps avoid ambiguity Source: Guidelines for the Design of SDMX Data Structure Definitions
DSD Design Tradeoffs: Simplicity vs Purity • A simple model may increase maintenance costs • Codes frequently need to be added • Difficult to map and consume • A pure model may increase the number of errors due its lower density • Some combinations of key values are impossible in reality but valid from the DSD point of view • Splitting the pure model into multiple DSDs to improve density may increase maintenance costs • Multiple DSDs and other artefacts need to be maintained