Download
1 / 47
470 likes | 646 Vues
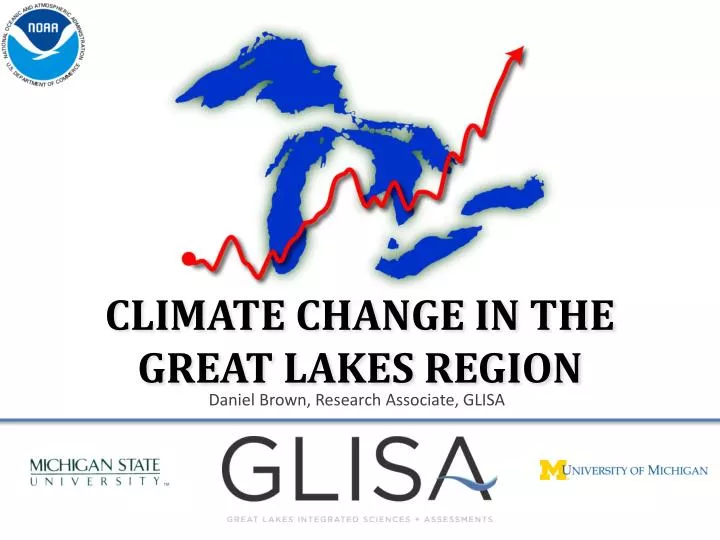
CLIMATE CHANGE IN THE GREAT LAKES REGION. Daniel Brown, Research Associate, GLISA. Regional Integrated Sciences and Assessments (RISA). What does GLISA do?. glisa.msu.edu. GLISA is an information network hub for integrated climate science Connects practitioners and scientists.

E N D
CLIMATE CHANGE IN THE GREAT LAKES REGION Daniel Brown, Research Associate, GLISA
What does GLISA do? glisa.msu.edu • GLISA is an informationnetwork hub for integratedclimate science • Connects practitionersand scientists
Why Care About Climate Change? "Everybody talks about the weather,but nobody does anything about it.”—Mark Twain, 1897 Climate regulates life on the planet.Climate determines how we live. Photo credits: michigan.org, MSU, Daniel Brown, Wikipedia.org, ahajokes.com
Outline of the Presentation Observed Changes How has the global and regional climate changed? Projected Future Changes What are the projected global and regional changes? Potential Impacts What are the expected regional impacts?
Observed Global Temperature ~1.5°F NASA, Hansen et al., 2006
The World is Warming… …but what about the Great Lakes Region?
A Migrating Climate • The climate future generations experience will be fundamentally different than the climate today. • By the end of this century, Michigan summers will feel more like current summers in Arkansas. Courtesy UCS 2009, original work by Hayhoe et al.
What has Changed? Scientists often discuss changes in terms of averages, but our environments are managed in terms of timing and extremes.
Migrating Plant Hardiness Zones -40 to -30 ºF -40 to -30 ºF -30 to -20 ºF -30 to -20 ºF -20 to -10 ºF -20 to -10 ºF -5 to -10 ºF 1990 2006 Average Extreme Minimum Temperatures
More Heat Waves and Hot Days Observed Change in Number ofHarmful Heat Waves The number of heat waves that pose risks to human health have increased in most major Midwestern cities.Increasing overnight, minimum temperatures have increased at a faster rate, limiting relief during hot periods. UCS Heat in the Heartland, 2012
Observed Snowfall 1961-1990 Average 1981-2010 Average More here Less here Snowfall has generally increased across the Northern Midwest, remained stable in the central latitudes, and has decreased in the southern areas.
Changing Winter Precipitation • Shorter winters have lead to more precipitation falling as rain instead of snow. • Warmer surface temperatures have reduced snowaccumulation. • More lake effectprecipitation eventshave increased snowfall in some areas. Photo credits: Umich.edu, NASA, weather.com
The Great Lakes are Warming Average Great Lakes ice coveragedeclined 71% percent from 1973 to 2010 • Lake Superior is warmingtwice as fast as nearby air. • Winter ice cover is decreasing. • Lake Superior could have little to no open-lake ice cover during a typical winter within the next 30 years. AMS, 2011 NASA Austin and Colman, 2007
Longer Midwestern Growing Season Growing season longer by ~1-2 weeks Earlier last winter frost in spring Date of first winter frost is often unchanged Based on data from the National Climatic Data Center for the cooperative observer network and updated from Kunkel et al. (2004)
Observed Extreme Precipitation The Intensity of the heaviest 1% of precipitation events increased by 31% in the Midwest and by 67% in the Northeast from 1958 to 2007.
Observed Extreme Precipitation The 10 wettest days in a year are delivering more precipitation. The frequency of the heaviest 7-day precipitation events has increased. (Pryor et al., 2009)
Lake Levels • Lake Michigan lake levels have fallen since the 1980s. • It is still unclear how much of the recent trend in lake levels may be attributed to climate change. GLERL Great Lakes Water Level Dashboard
Summary of Existing Trends Temperature is rising Especially in winter Winters are shorter Spring comes earlier Less ice cover Precipitation is changing More rain More snow becoming rain More extreme events Lake levels are declining
Future Global Temperature 6.5°F 3.2°F 3.2°F NASA, based on IPCC
How Good are Climate Models? Natural and Human Climate Influences Natural Climate Influences IPCC, modified Observed changes in temperature since theIndustrial Revolution cannot be accurately representedwithout including human influences.
Future Midwest Temperature High Emissions Scenario Low Emissions Scenario Modified from Hayhoe et al, 2010
More Hot Days 2041-2070 Increase in Days > 95°F Increase in Consecutive Days > 95°F Kunkel (2011)
Projected Precipitation Annual +5 to 15% 2041-2070 vs. 1971-2000 Spring +0 to 20% Winter +5 to 20% Fall +0 to 20% Summer +10 to -10% Kunkel (2011)
Projected Snowfall Days Hayhoe et al (2010)
Summary of Projected Changes Temperature • Winter + 7 (5-10)°F • Summer + 9 (5-12)°F • Extreme heat more common Precipitation • Winter, Spring, Fall increasing • Summer Decreasing – drier soils, more droughts More extreme events– storms, floods Ice cover decline will continue
Impacts of Climate Change in the Great Lakes Region Changes in temperature and precipitation throughout the region will lead to many impacts in both engineered and natural environments. Fish Water Energy Forests Agriculture Biodiversity Public Health Transportation Birds and Wildlife Tourism and Recreation
Projected Heat-Related Deaths in Chicago High Emissions Low Emissions Observed USGCRP (2009)
Water Quality Climate Change will increase the risk of many existing water quality and environmental issues. NASA
Impacts of Climate Change on Forests • Amplification of existing stressors, such as invasive species, pests and pathogens • Many tree species will not be able to migrate quickly enough to keep pace with climate change • As the timing and extent of many recreation opportunities in forests will change, cultural connections to forests will be lost.
Projected Shifts in Forest Types Maple-Beech-Birch Oak-Hickory USGCRP (2009)
Climate Change Impacts on Biodiversity • Climate change will amplify existing stressors on biodiversity, including sensitivity to land and water use. • Some species will need to migrate faster relative to other parts of the continent to keep up with the pace of warming. Large agricultural areas and the Great Lakes pose major obstacles to species migration.
Changing Fish Populations Warmer lake temperatures Warmwater species (carp, perch, bass) gain advantage over existing coldwater species (salmon, trout) Implications for recreational fishing and tourism
Bird Species Changes and Losses • Some species will gain an advantage while others are forced out of the region. • Even with new species in the region, Michigan will see a drop in the total number of bird species. Summer Tanager Will likely see populations grow American Goldfinch Will likely see populations decline Hellmann et al (2010)
Longer Projected Growing Season Earlier last winter frost in spring Later first winter frost in autumn Growing season longer by ~1-2 months Wubbles & Hayhoe (2004)
Climate Change Impacts on Agriculture • Increasing intensity of severe stormsincreases the risk of runoff anderosion. • Shifts in the timing of precipitationwill affect field preparation timein spring. • Some crops may benefit in the near future from increasing carbon dioxide concentrations until negated by warmer temperatures. • Perennial crops may be more vulnerable to the pace of climate change and may face greater adaptation challenges.
Agriculture Vulnerabilities Example: Spring 2012 and Cherry Crops • The early warming wasextreme weather event. • The seasonal warming fitsa pattern of a morevariable climate. • The early warming followed by a normal hard freeze was devastating to cherry buds.
A Vulnerability Example:Early Spring Warming and Tart Cherries 2012 Date of Side Green vs. Year 1901-2012, Traverse City, MI
Climate Change Impacts on Energy Extreme weather events would further burden the supply of electricity. Overall, warmer temperatures may decrease the efficiency of electrical generation equipment in the Midwest. Climate change policy will have an indelible impact on the energy sector.
Potential Transportation Impacts Freeze-thaw Expansion buckling Freeze-thaw damage, near Marquette, MI Expansion buckling near Marshall, MI, 2011 Flood Damage, washouts Jane-Finch.com
How will we adapt? • Winter is a part of our “Sense of Place”. We are losing Winter as we once knew it.-John Magnuson