Fire Hazard Assessment Map for Canada Fire-HAM
1.21k likes | 1.5k Vues
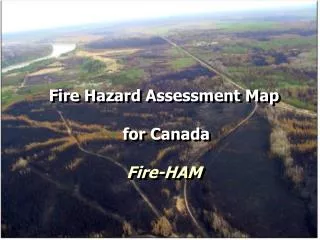
Fire Hazard Assessment Map for Canada Fire-HAM. Fire-HAM. To produce a fire hazard assessment map for Canada that indicates the areas which are susceptible or vulnerable to forest fire activity. Goal. Objectives.

Fire Hazard Assessment Map for Canada Fire-HAM
E N D
Presentation Transcript
Fire Hazard Assessment Map for Canada Fire-HAM
Fire-HAM To produce a fire hazard assessment map for Canada that indicates the areas which are susceptible or vulnerable to forest fire activity. Goal Objectives • Use latest knowledge to replace the 1973 Fire Weather Zone Map for Canada (Simard) • Build a map using the concepts of the Wildfire Threat Rating System (WTRS) • Incorporate fire occurrence, area burned, level of protection and social-economic impacts • Use GIS to display spatial patterns
Fire-HAM Objectives • Consider ALL Fires; since every fire requires a suppression response • Use EcoRegion for areas of analysis • Indicate the changing Fire Hazard Assessment over the last 20 years • Build a Small Fire Database (SFDB) for Canada
Province Abbrev. Years # Records File Yukon YK 1946 - 2001 5,922 YK_4601.csv Northwest Territories NWT 1965 - 2000 10,223 NWT_6500.csv British Columbia BC 1950 - 1960 18,416 BC_5060.csv BC 1961 - 1980 47,462 BC_6180.csv BC 1981 - 2000 48,354 BC_8100.csv Alberta AB 1961 - 2000 32,992 AB_6100.csv Saskatchewan SK 1981 - 2002 14,790 SK_8102.csv Manitoba MB 1968 - 1999 17,444 MB_6899.csv Ontario ON 1976 - 1999 41,100 ON_7699.csv Quebec PQ 1985 - 2000 14,935 PQ_8500.csv Wood Buffalo Nat. Park WBNP 1950 - 1999 1,335 WBNP_5099.csv Newfoundland * NF 1955 - 1999 * 367 NF_5599.csv New Brunswick * NB 1980 - 1999 * 35 NB_8099.csv Nova Scotia * NS 1980 - 1999 * 6 NS_8099.csv Other National Parks * NatPks 1950 - 1999 * 37 NatPks_5099.csv Fire-HAM • National Fire Occurrence Database • Contains 32 Fields – 14 Required; 18 Optional • Atlantic provinces and National Parks contain only LFDB records SFDB
IMPACTS Area Burned Social Economic Fire Occurrence Level of Protection Size, Pattern, Fire Effects, Carbon Emissions, Succession, Timber Supply Models Number of Fires, Fire Locations, Seasonality, Eco-region Patterns Human Health Loss of Property Cost / Benefit Analysis Suppression Locations, Suppression Effectiveness, Adaptation Strategies, Mitigation Practices TOOLS PROMETHEUS Fire Growth Model BURN-P3 Burn Probability CFFDRS FWI - FBP FOP Models LEOPARDS Level of Protection Protection Zones Landscape Fuel STRUCTURE ( Continuity, Loading, HFI, ROS, TFC ) Fire Weather FWI / FBP People FIRES Suppression Resources People Activity Patterns Values At Risk Towns, Parks, Roads FBP Fuel Types % Coverage Lightning FIRES Community Protection Recreation GCM / RCM Outputs ECOREGION Information Wildland Urban Interface Timber Supply Lightning Occurrence Patterns Ecosystem Values Other Industry Use Forest Fire and Climate Change HAZARD ASSESSMENTMap for CANADA FIRE-HAM
Fire Occurrence & Area Burned for All Causes - 1920 to 1999 • Incomplete records prior to 1970 • Annually • Now 8000 fires • 2.8 million ha/yr • $500 million spent on Suppression • Cyclic Patterns • Area Burned Seems to be Increasing
Fire Occurrence by Fire Causes - 1981 to 2000 • Seasonal Pattern Exists • January to December vs May to August • Fewer fires in 1991-2000 decade • Ratio of Human to Lightning fires by Decade may be artificial • LLP Systems introduced in mid 80’s and changed fire cause ratios
Area Burned (AB) By Fire Causes - 1981 to 2000 • Seasonal Pattern Exists • January to December vs May to August • Almost Twice AB in 1991-2000 decade as compared to 1981-1990
Tables of Fire Occurrence and Area Burned by ECoRegion and EcoZones 1981 to 2000
Tables of Fire Occurrence and Area Burned by ECoRegion and EcoZones 1981 to 2000
Mean Annual Fire Occurrence for Canada by EcoRegion
Step # 1 • Convert FIRE OCCURRENCE data to spatial Ecoregion format • Mean Annual Fire occurrence • Percent Annual Fire Occurrence (PAFO) • Mean Annual Area burned • Percent Annual Area burned (PAAB) • Breakdowns • Years Used • 1981-2000 • 1981-1990 • 1991 -2000 • Periods Used • January to December • May to August • Monthly • Cause Types Used • All causes • Human-caused • Lightning-caused
0 – 1 2 – 10 11 - 50 51 - 100 101 - 150 151 – 200 201 – 275 275 – 350 351 + Mean Annual Fire Occurrence All Causes January to December / 1981 to 2000
0 – 1 2 – 10 11 - 50 51 - 100 101 - 150 151 – 200 201 – 275 275 – 350 351 + Mean Annual Fire Occurrence All Causes January to December / 1981 to 1990
0 – 1 2 – 10 11 - 50 51 - 100 101 - 150 151 – 200 201 – 275 275 – 350 351 + Mean Annual Fire Occurrence All Causes January to December / 1991 to 2000
0 – 1 2 – 10 11 - 50 51 - 100 101 - 150 151 – 200 201 – 275 275 – 350 351 + Mean Annual Fire Occurrence All Causes January to December 1981 - 2000 1981 - 1900 1991 - 2000
0 – 1 2 – 10 11 - 25 26 - 50 51 - 100 101 – 150 151 – 200 201 – 250 251 + Mean Annual Fire Occurrence Human-caused January to December 1981 - 2000 1981 - 1900 1991 - 2000
0 – 1 2 – 10 11 - 25 26 - 50 51 - 100 101 – 150 151 – 205 201 – 250 251 + Mean Annual Fire Occurrence Lightning-caused January to December 1981 - 2000 1981 - 1900 1991 - 2000
0 – 1 2 – 10 11 - 50 51 - 100 101 - 150 151 – 200 201 – 275 275 – 350 351 + Mean Annual Fire Occurrence All Causes May to August 1981 - 2000 1981 - 1900 1991 - 2000
0 – 1 2 – 10 11 - 25 26 - 50 51 - 100 101 – 150 151 – 205 201 – 250 251 + Mean Annual Fire Occurrence Human-caused May to August 1981 - 2000 1981 - 1900 1991 - 2000
0 – 1 2 – 10 11 - 25 26 - 50 51 - 100 101 – 150 151 – 205 201 – 250 251 + Mean Annual Fire Occurrence Lightning-caused May to August 1981 - 2000 1981 - 1900 1991 - 2000
Percent Annual Fire Occurrence For Canada
Percent Annual Fire Occurrence (*1000) All Causes January to December / 1981 to 2000 0 – 0.005 0.005 - 0.05 0.05 – 0.10 0.11 – 0.50 0.51 – 1.0 1.11 – 2.5 2.51 – 5.0 5.01 – 7.5 7.51 +
Percent Annual Fire Occurrence All Causes January to December / 1981 to 1990 0 – 0.005 0.005 - 0.05 0.05 – 0.10 0.11 – 0.50 0.51 – 1.0 1.11 – 2.5 2.51 – 5.0 5.01 – 7.5 7.51 +
Percent Annual Fire Occurrence All Causes January to December / 1991 to 2000 0 – 0.005 0.005 - 0.05 0.05 – 0.10 0.11 – 0.50 0.51 – 1.0 1.11 – 2.5 2.51 – 5.0 5.01 – 7.5 7.51 +
Mean Annual Area Burned
1 – 100 101 – 1,000 1,001 – 5,000 5,001 – 10,000 10,001 – 50,000 50,001 – 100,000 100,001 – 200,000 200,001 – 400,000 400,001 + Mean Annual Area Burned All Causes January to December 1981 - 2000 1981 - 1900 1991 - 2000
1 – 100 101 – 1,000 1,001 – 2,500 2,501 – 5,000 5,001 – 10,000 10,001 – 50,000 50,001 – 100,000 100,001 – 200,000 200,001 + Mean Annual Area Burned Human-caused January to December 1981 - 2000 1981 - 1900 1991 - 2000
1 – 100 101 – 1,000 1,001 – 2,500 2,501 – 5,000 5,001 – 10,000 10,001 – 50,000 50,001 – 100,000 100,001 – 200,000 200,001 + Mean Annual Area Burned Lightning-caused January to December 1981 - 2000 1981 - 1900 1991 - 2000
Mean Annual Area Burned All Causes May to August 1981 - 2000 1 – 100 101 – 1,000 1,001 – 5,000 5,001 – 10,000 10,001 – 50,000 50,001 – 100,000 100,001 – 200,000 200,001 – 400,000 400,001 + 1981 - 1900 1991 - 2000
Percent Annual Area Burned For Canada
0 – 0.005 0.005 - 0.01 0.01 – 0.25 0.26 – 0.50 0.51 – 1.0 1.1 – 2.0 2.1 – 3.0 3.1 – 10.0 10.1 + Percent Annual Area Burned All Causes January to December 1981 - 2000 1981 - 1900 1991 - 2000
0 – 0.005 0.005 - 0.01 0.01 – 0.25 0.26 – 0.50 0.51 – 1.0 1.1 – 2.0 2.1 – 3.0 3.1 – 10.0 10.1 + Percent Annual Area Burned Human-caused January to December 1981 - 2000 1981 - 1900 1991 - 2000
0 – 0.005 0.005 - 0.01 0.01 – 0.25 0.26 – 0.50 0.51 – 1.0 1.1 – 2.0 2.1 – 3.0 3.1 – 10.0 10.1 + Percent Annual Area Burned Lightning-caused January to December 1981 - 2000 1981 - 1900 1991 - 2000
0 – 0.005 0.005 - 0.01 0.01 – 0.25 0.26 – 0.50 0.51 – 1.0 1.1 – 2.0 2.1 – 3.0 3.1 – 10.0 10.1 + Percent Annual Area Burned Cause Types May to August All 1981 - 2000 Human 1981 - 2000 Lightning 1981 - 2000
FWI Maps for Canada
Step # 2 • Convert WEATHER data to spatial Ecoregion format • Originally created from AES 1953-1995 data • Created in sFMS and converted to Ecorregion • Data • Period is May to August Fire Season • Mean Annual 90th Percentile • FFMC, DMC, DC, ISI, BUI, FWI, DSR • Other statistical data types available • Mean, Min, Max, 50th, 80th
Mean Annual 90th Percentile FFMC May to August 1981 - 1990 0 - 82 82 - 84 84 - 86 86 - 88 88 - 90 90 - 92 92 + Grid Map with Ecoregions Overlaid EcoRegion Map
0 - 15 15 - 25 25 - 35 35 - 45 45 - 60 60 - 75 75 + Mean Annual 90th Percentile DMC May to August 1981 - 1990 Grid Map with Ecoregions Overlaid EcoRegion Map
0 - 200 200 - 250 250 - 300 300 - 350 350 - 400 400 - 450 450 + Mean Annual 90th Percentile DC May to August 1981 - 1990 Grid Map with Ecoregions Overlaid EcoRegion Map
0 - 4 4 - 6 6 - 8 8 - 10 10 - 11 11 - 12 12 + Mean Annual 90th Percentile ISI May to August 1981 - 1990 Grid Map with Ecoregions Overlaid EcoRegion Map
0 - 25 25 - 35 35 - 45 45 - 60 60 - 75 75 - 90 91 + Mean Annual 90th Percentile BUI May to August 1981 - 1990 Grid Map with Ecoregions Overlaid EcoRegion Map
0 - 5 5 - 10 10 – 15 15 - 20 20 - 25 25 - 30 30 + Mean Annual 90th Percentile FWI May to August 1981 - 1990 Grid Map with Ecoregions Overlaid EcoRegion Map
Mean Annual 90th Percentile DSR May to August 1981 - 1990 0 - 1 1 - 2 2 – 5 5 - 7 7 - 10 10 - 15 15 + Grid Map with Ecoregions Overlaid EcoRegion Map
Miscellaneous Maps
Step # 3 • Create OTHER spatial Ecoregion maps • Ecoregion Map • Basic Level of Protection Map
EcoRegions of Canada 41 68 64 180 69 71 142 202 74 88 147 145 72 89 205 95 101 217 99
Intensive Modified Extensive Outside Fire Protection Zones for Canada
Step # 4 • Create Hazard Assessment Maps by Ecoregion • Classify each map type into categories • Fire and AB – 9 classes • FWI – 7 classes • Protection – 2 classes • Define rule sets and weights for combining maps • Possible Maps which could be created • Decadal Periods 1981-2000, 1981-1990, 1991-2000 • Seasonal Periods Jan-Dec, May-August, Monthly • Rule Sets • #1 – HAM = Fires + Area Burned + BUI + Protection • #2 – HAM = (Fires + Area Burned + BUI) * Protection • #3 – HAM = Fires + Area Burned + DSR + Protection • #4 – HAM = (Fires + Area Burned + DSR) * Protection