ENVIRONMENTAL AUDITING
FUNDED BY THE EUROPEAN COMMISSION. S ustainable and C leaner Production in the Manufacturing I ndustries of Pak istan SCI-Pak Mar 2009- Feb 2012. ENVIRONMENTAL AUDITING. Introduction. Environmental Issues - Wastewater generation - Air emissions (Point & Diffused)

ENVIRONMENTAL AUDITING
E N D
Presentation Transcript
FUNDED BY THE EUROPEAN COMMISSION Sustainable and Cleaner Production in the ManufacturingIndustries of Pakistan SCI-Pak Mar 2009- Feb 2012 ENVIRONMENTAL AUDITING
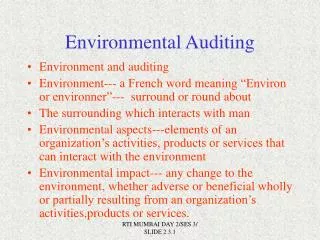
Introduction Environmental Issues - Wastewater generation - Air emissions (Point & Diffused) - Solid waste generation - Soil contamination - Occupational health and safety issues (Noise, light, working conditions, chemical handling and storage, PPE use, fire hazard etc) - Resource wastage (raw materials, water, chemicals etc)
Introduction Environmental Audit Thistechnique is used to: - Identify environmental issues of the organization - Quantify these issues - Evaluate their impacts and - Lay down recommendations to control them Benefits - Resource conservation (Reduction in raw material) - Waste minimization - Pollution control - Cost reduction - Treatment cost reduction - Competitive - Working conditions are improved - Process efficiency is improved
Introduction Waste Waste is taken as a broad term to include any non product discharge from a process. Thus, it discharges in the gaseous, liquid and solid phases. Past Practice of Waste Management In the past, waste management has concentrated on end of pipe waste treatment, designing of waste treatment plants and installing pollution control equipment to prevent contamination of the environment.
Introduction Environmental Auditing Module 2
Introduction Recent Trend of Waste Management A different philosophy has emerged in recent times, that of waste prevention and reduction. Now we ask how can we prevent the generation of this waste? How can we reduce this waste? Can we reuse, recycle or recover this waste?
Introduction How You Can Manage Your Waste In order to prevent or reduce waste generation you need to examine your process to identify the origins of wastes, the potential problems associated with your process and those areas where improvements can be made. Environmental Audit Environmental audit is the first step in an on going program designed to achieve maximum resource optimization and improved process performance. It is a Common Sense Approach to problem identification and problem solving. Environmental audit enables you to take a comprehensive look at your site or process to facilitate your understanding of material flows and to focus your attention on areas where waste reduction and therefore cost saving is possible.
Introduction Undertaking environmental audit involves observing, measuring, recording data and collecting and analyzing waste samples. To be effective, it must be done systematically and thoroughly together with full management and operator support. A Good Environmental Audit: - Defines sources, quantifies types of waste being generated - Collates information on unit operations, raw material, products, water usage and wastes - Highlights process inefficiencies and areas of poor management - Helps set targets for waste reduction - Permits the development of cost effective waste management strategies
Introduction -Raises awareness in the workforce regarding the benefits of waste reduction - Increases your knowledge of the process - Helps to improve process efficiency
Audit Procedure Phases of Audit Phase 1: Pre Assessment Phase 2: Material Balance: Process Inputs and Outputs Phase 3: Synthesis
Audit Procedure Phase 1: Pre Assessment Step 1: Audit Focus and Preparation - Identification of audit team (3 or 4 people including technical, production and environmentalist) - Laboratory facility - Equipment for sampling and flow measurement - Identify the scope of the audit (Complete process or selected areas) - Literature review to identify the problem areas of the industry - Collect relevant information of the plant (Layout plan, annual production and waste record , process flow diagram, previous laboratory analysis reports etc)
Audit Procedure Phase 1: Pre Assessment - Inform the auditee and employees about the audit and encourage them to take part in the audit process Step 2: Conducting the Audit Visit
Conducting the Audit Visit Once the preliminary information has been obtained, the audit equipment can be gathered up, and the actual visit to the facility can be made. Introductory Meeting The audit person or team should meet with the facility manager and the maintenance supervisor and briefly discuss the purpose of the audit and indicate the kind of information that is to be obtained during the visit to the facility.
Conducting the Audit Visit Walk Through Tour A walk through tour of the facility or plant tour should be conducted by the facility/plant manager, and should be arranged so the auditor or audit team can see the major operational and equipment features of the facility. The main purpose of the walk through tour is to obtain general information. More specific information should be obtained from the production, maintenance and operational people after the tour. This tour is essential to have the feel of the facility. Audit Interviews Getting the correct information on facility equipment and operation is important if the audit is going to be most successful in identifying ways to reduce waste. The company philosophy towards investments, the impetus behind requesting the audit, and the expectations from the audit can be determined by interviewing the general manager, chief operating officer, or other executives.
Conducting the Audit Visit The facility manager or plant manager is one person that should have access to much of the operational data on the facility, and a file of data on facility equipment. The finance officer can provide any necessary financial records. The auditor must also interview the floor supervisors and equipment operators to understand the process problems. Line or area supervisors usually have the best information on times their equipment is used. The maintenance supervisor is often the primary person to talk to about the maintenance problems which cause wastages. Auditor should write down these people’s names, job functions and telephone numbers, since it is frequently necessary to get information after survey.
Conducting the Audit Visit Getting Detailed Data Following the facility or plant tour, the auditor or audit team should acquire the detailed data on facility equipment and operation that will lead to identifying the significant waste reduction opportunities that may be appropriate for this facility.
Audit Procedure Phase 2: Material Balance: Process Input and Outputs Step 3: Constructing Process Flow Diagram Step 4: Determining Inputs (raw material, chemicals, water, air and power) Step 5: Recording Water Usage (sources, storage, process wise use, quality, quantity, wastage etc) Step 6: Measuring Current Levels of Waste Reuse/Recycling Step 7: Quantifying Process Outputs (Products, by products, wastewater, gaseous waste, liquid and solid waste etc) Step 8: Accounting for Wastewater (Sources, quantity, quality Step 9: Accounting for Gaseous Emissions Step 10; Accounting for Off Site Wastes Step 11: Prepare a Material Balance
Audit Procedure OPERATION TECHNOLOGY PRODUCTION PROCESS PRODUCTS INPUT MATERIALS WASTE & EMISSIONS
Audit Procedure RAW MATERIALS GASEOUS EMISSIONS PLANT PROCESS OR UNIT OPERATION CATALYST PRODUCT WATER/AIR POWER BY-PRODUCT INCLUDING WASTES FOR RECOVERY RECYCLE WASTEWATER LIQUID WASTE FOR STORAGE AND/OR OFF-SITE DISPOSAL REUSEABLE WASTE IN ANOTHER OPERATION SOLID WASTES FOR STORAGE AND/OR OFF-SITE DISPOSAL
Post Audit Analysis Following the audit visit to the facility, the data collected should be examined, organized and reviewed for completeness. Any missing data item should be obtained from the facility personnel or from a re-visit to the facility.
Audit Procedure Phase 3: Synthesis Step 12; Examining Obvious Waste Reduction Measures Step 13: Environmental and Economic Evaluation of Waste Reduction Options Step 14: Developing and Implementing An Action Plan for Reducing Waste and Increasing Production Efficiency
Common Tools for Environmental Audit Following are the common tools used during environmental audit: - Measuring Tape - Light meter - Thermometer (Common digital and Infrared) - Combustion analyzer - Air flow measurement devices (Anemometer) - Hygrometer (Humidity measurement) - Noise meter - V Notch for wastewater flow measurement - pH and water hardness meters - Safety equipment (helmet, goggles, dust masks, safety shoes, gloves etc)
Portable Stack gas Analyzers Steam Flow meters pH Meter TDS Meter Temperature and Pressure Gauges Water Flow Meter
Safety Considerations Safety is a critical part of any environmental audit. The auditor or the auditing team should be thoroughly briefed on safety equipment and procedures, and should never place themselves in a position where they could injure themselves or other people at the facility. Adequate safety equipment should be worn at all appropriate times. Auditors should be extremely careful making any measurements on electrical systems, or on high temperature devices such ass boilers, heaters, cookers etc. Electrical gloves should be worn as appropriate. Auditor should be careful when examining any operating piece of equipment, especially those with open drive shafts, belts or gears, or any form of rotating machinery. The equipment operator or supervisor should be notified that the auditor is going to look at that piece of equipment and might need to get information from some part of the devices. The auditor should never approach the equipment without operator.
Environmental Audit Report The next step in the environmental audit process is to prepare a report which details the final results and recommendations. The length and detail of this report will vary depending on the type of facility audited. Environmental Audit Report Format Executive Summary A brief summary of recommendations for waste reduction Table of Contents Introduction Purpose of the environmental audit Organizational and Physical Settings Size, construction, facility layout and hours of operation, equipment list with specification, location, location plan, management hierarchy etc
Environmental Audit Report Production Process Description of the complete process. Provide process flow diagram and consumption of raw material and utilities, product quantities plant lay out etc Environmental Issues Description of environmental issues (Wastewater, solid waste, liquid waste, gaseous emissions, noise, occupational health and safety, lighting, chemical storage etc Recommendations Listing of potential waste reduction opportunities (Cleaner production options), cost and savings analysis, environmental and economic evaluation, occupational health and safety measures, good housekeeping, end of pipe treatment
Environmental Audit Report Action Plan Recommended opportunities and an implementation schedule, designation of an environmental monitoring and ongoing program Reference: Audit and Reduction Manual for Industrial Emissions and Wastes by UNIDO and UNEP
CASE STUDY Environmental Audit of ABC Textile Industry
Case Study General Information Medium sized textile processing industry. Woven fabric is processed to produce dyed and printed fabric. Year of its operation: 1947 Member of All Pakistan Textile Processing Mills Association (APTPMA). Location and Surroundings Located at north of Sheikhupura Road and west of G.T Road. Surrounding area is fully developed with residential and industrial land uses. (Types of industries, agricultural and commercial activities, residential areas etc)
Case Study Drainage and Disposal Two drains carry wastewater and dispose off into the municipal sewer. Wastewater is discharged without any treatment. This wastewater from municipal sewer is discharged into the nearby earthen drain, which ultimately falls into the River Ravi. Plant Layout Total land area is 17,000 m2, two storey building. Ground floor covers nearly 100% area whereas 1st floor covers 70-80%. Plant layout is attached. Description of the plant layout. Machinery and Auxiliary Equipment
Case Study Management and Organization ISO 9001 certified. Interested to acquire ISO 14001 certification. Organizational structure. Total 64 workers, 24 working hours, three shifts, 300 working days/yr Raw Material Grey fabric (Cotton & PC) Chemicals (Enzymes, bleaching agents, dyes, pigments, salts, acids, alkalis, sequestering agents, softeners, soaps, detergents Finished Products Dyed : 2.7 million meters/yr Dyed-printed: 7.3 million meters/yr Total: 10 million meters/yr
Case Study Production Process Pretreatment: Grey fabric inspection, desizing, scouring, bleaching, neutralization, drying, mercerization Dyeing Printing: Rotary printing, flat belt printing, steam aging, washing Finishing: Chemical finishing, mechanical finishing Process Chemicals Estimated quantities of chemicals are added. Industry did not share the complete chemical consumption and process recipes. Use of sodium hypochlorite in bleaching is discouraged these days due to environmental consequences.
Case Study Production: 12,192 kg
Case Study Utilities Water: Groundwater, two tube wells, Water consumption estimation on the basis of tube well capacity and running hours (420,000 m3/yr) Electricity:LESCO is the source, standby diesel generator but operational frequency is not much. Annual consumption is 2,079,258 kWh. Fuels: Natural gas (SNGPL) is the major source of fuel (boiler, rotary printing dryer, stenter dryer and screen development), annual gas consumption is 3,706,941 m3. Steam: Direct and indirect use. Annual consumption is 1,500 ton/yr)
Case Study Unit Consumption of Utilities Process Flow Diagram
Case Study General Conditions Structure: Old, cracks, damaged plasters, floor levels are uneven, leakages in the roof, light is not appropriate, Drainage System: Made of bricks and plastered, covered with slabs, some small drains are not in good condition and are under capacity (Wastewater is get flooded, it overflows and makes floors wet and slippery. Plumbing: Not in a good condition. Corrosion, leakage, faulty valves Electrification: Condition of electric panels is not good (dirt & fluff), electric wires and conduits are not properly fixed; bare electric wires
Case Study Water Washes, steam generation, floor and vessel cleaning, water quality (TDS 425 ppm, hardness 238 ppm). Hard water which can cause scaling in process vessels and consumes more chemicals, water is softened for boiler feed water Water Consumption Practices Management and workers are not much concerned about excessive water use, no water monitoring and record keeping Water Wastages Water hoses Cooling water No countercurrent washes Jigger dyeing washes
Case Study Water Consumption Estimation Estimation through tube wells capacity and running hours Water flows measurement and estimation on machines Wastewater flow monitoring
Case Study Wastewater Flow Monitoring Drain 1: 700 m3/d Drain 2: 600 m3/d Total wastewater flow: 1,300 m3/d Wastewater Characteristics BDL: Below Detection Limit
Case Study Mercerization Wastewater Characteristics 1st wash: 2.57% NaOH 2nd wash: 1.6% NaOH 3rd wash: 0.8% NaOH NaOH wasted per day: 870 kg (100%) Annual wastage: Rs. 8,000,000 Pollution Load COD: 1,250 kg/d, 250 gm/kg of product BOD: 290 kg/d, 60 gm/kg of product TSS: 680 kg/d, 140 gm/kg of product
Case Study Air Emission Monitoring
Case Study Light Levels
Case Study Noise Levels
Case Study Solid Waste
Case Study Occupational Health & safety Issues Characteristics Hot Working atmosphere Improper chemical handling and storage No use of Personal Protective Equipment (PPE) Absence of safety guards Absence of safety instructions