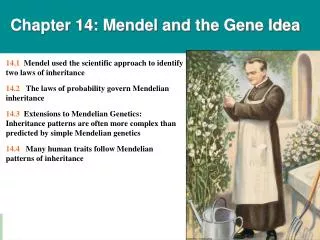
Chapter 14 Mendel and the Gene Idea
230 likes | 494 Vues
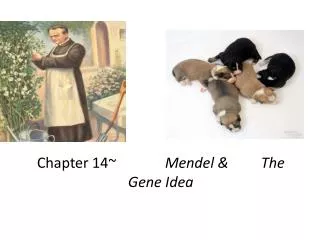
Chapter 14 Mendel and the Gene Idea. Figure 14.1Â Gregor Mendel and his garden peas. Removed stamens from purple flower. 1. APPLICATION By crossing (mating) two true-breeding varieties of an organism, scientists can study patterns of

Chapter 14 Mendel and the Gene Idea
E N D
Presentation Transcript
Chapter 14 Mendel and the Gene Idea
Removed stamens from purple flower 1 APPLICATION By crossing (mating) two true-breeding varieties of an organism, scientists can study patterns of inheritance. In this example, Mendel crossed pea plants that varied in flower color. Transferred sperm- bearing pollen from stamens of white flower to egg- bearing carpel of purple flower 2 TECHNIQUE TECHNIQUE RESULTS TECHNIQUE Parental generation (P) Stamens (male) Carpel (female) Pollinated carpel matured into pod 3 Planted seeds from pod 4 When pollen from a white flower fertilizes eggs of a purple flower, the first-generation hybrids all have purple flowers. The result is the same for the reciprocal cross, the transfer of pollen from purple flowers to white flowers. Examined offspring: all purple flowers 5 First generation offspring (F1) Figure 14.2 Research Method Crossing Pea Plants
P Generation (true-breeding parents) Purple flowers White flowers F1 Generation (hybrids) All plants had purple flowers F2 Generation Figure 14.3 When F1 pea plants with purple flowers are allowed to self-pollinate, what flower color appears in the F2 generation EXPERIMENT True-breeding purple-flowered pea plants and white-flowered pea plants were crossed (symbolized by ). The resulting F1 hybrids were allowed to self-pollinate or were cross- pollinated with other F1 hybrids. Flower color was then observed in the F2 generation. RESULTS Both purple-flowered plants and white- flowered plants appeared in the F2 generation. In Mendel’s experiment, 705 plants had purple flowers, and 224 had white flowers, a ratio of about 3 purple : 1 white.
Table 14.1 The Results of Mendel’s F1 Crosses for Seven Characters in Pea Plants
Allele for purple flowers Homologous pair of chromosomes Locus for flower-color gene Allele for white flowers Figure 14.4 Alleles, alternative versions of a gene
Each true-breeding plant of the parental generation has identical alleles, PP or pp. Gametes (circles) each contain only one allele for the flower-color gene. In this case, every gamete produced by one parent has the same allele. P Generation Appearance:Genetic makeup: Purple flowerPP White flowerspp Gametes: p P Union of the parental gametes produces F1 hybrids having a Pp combination. Because the purple- flower allele is dominant, all these hybrids have purple flowers. When the hybrid plants produce gametes, the two alleles segregate, half the gametes receiving the P allele and the other half the p allele. F1 Generation Appearance:Genetic makeup: Purple flowersPp Gametes: Figure 14.5 Mendel’s law of segregation (layer 1)
Each true-breeding plant of the parental generation has identical alleles, PP or pp. Gametes (circles) each contain only one allele for the flower-color gene. In this case, every gamete produced by one parent has the same allele. P Generation Appearance:Genetic makeup: Purple flowerPP White flowerspp Gametes: p P Union of the parental gametes produces F1 hybrids having a Pp combination. Because the purple- flower allele is dominant, all these hybrids have purple flowers. When the hybrid plants produce gametes, the two alleles segregate, half the gametes receiving the P allele and the other half the p allele. F1 Generation Appearance:Genetic makeup: Purple flowersPp Gametes: 1/2 1/2 p P F1 sperm This box, a Punnett square, shows all possible combinations of alleles in offspring that result from an F1 F1 (PpPp) cross. Each square represents an equally probable product of fertilization. For example, the bottom left box shows the genetic combination resulting from a p egg fertilized by a P sperm. p P F2 Generation P Pp PP F1 eggs p pp Pp Random combination of the gametes results in the 3:1 ratio that Mendel observed in the F2 generation. 3 : 1 Figure 14.5 Mendel’s law of segregation (layer 2)
Phenotype Genotype Purple PP (homozygous) 1 Pp (heterozygous) 3 Purple 2 Pp (heterozygous) Purple pp (homozygous) White 1 1 Ratio 3:1 Ratio 1:2:1 Figure 14.6 Phenotype versus genotype
Dominant phenotype, unknown genotype: PP or Pp? Recessive phenotype, known genotype: pp APPLICATION An organism that exhibits a dominant trait, such as purple flowers in pea plants, can be either homozygous forthe dominant allele or heterozygous. To determine the organism’s genotype, geneticists can perform a testcross. TECHNIQUE In a testcross, the individual with the unknown genotype is crossed with a homozygous individual expressing the recessive trait (white flowers in this example). By observing the phenotypes of the offspring resulting from this cross, we can deduce the genotype of the purple-flowered parent. If PP, then all offspring purple: If Pp, then 1⁄2 offspring purple and 1⁄2 offspring white: p p p p RESULTS P P Pp Pp Pp Pp P p Pp pp Pp pp Figure 14.7 The Testcross
EXPERIMENT Two true-breeding pea plants—one with yellow-round seeds and the other with green-wrinkled seeds—were crossed, producing dihybrid F1 plants. Self-pollination of the F1 dihybrids, which are heterozygous for both characters, produced the F2 generation. The two hypotheses predict different phenotypic ratios. Note that yellow color (Y) and round shape (R) are dominant. P Generation YYRR yyrr Gametes YR yr F1 Generation YyRr RESULTS Hypothesis of independent assortment Hypothesis of dependent assortment Sperm Yr 1 ⁄4 1 ⁄4 YR 1 ⁄4 yR yr 1 ⁄4 Sperm Eggs 1 ⁄2 yr 1 ⁄2 YR 1 ⁄4 YR Eggs YyRr YYRR YYRr YyRR 1 ⁄2 YR F2 Generation (predicted offspring) YYRR YyRr 1 ⁄4 Yr YYrr Yyrr YyRr YYrr yr 1 ⁄2 yyrr YyRr 1 ⁄4 yR YyRR YyRr yyRR yyRr 3 ⁄4 1 ⁄4 yr 1 ⁄4 Phenotypic ratio 3:1 Yyrr YyRr yyRr yyrr CONCLUSION The results support the hypothesis of independent assortment. The alleles for seed color and seed shape sort into gametes independently of each other. 1 ⁄16 3 ⁄16 3 ⁄16 9 ⁄16 Phenotypic ratio 9:3:3:1 108 315 101 Phenotypic ratio approximately 9:3:3:1 32 Figure 14.8 Do the alleles for seed color and seed shape sort into gametes dependently (together) or independently?
Rr Segregation of alleles into eggs Rr Segregation of alleles into sperm Sperm r R 1⁄2 1⁄2 R R r R R 1⁄2 1⁄4 1⁄4 Eggs r r R r r 1⁄2 1⁄4 1⁄4 Figure 14.9 Segregation of alleles and fertilization as chance events
P Generation White CWCW Red CRCR Gametes CR CW Pink CRCW F1 Generation 1⁄2 1⁄2 Gametes CR CR Sperm 1⁄2 1⁄2 CR CR Eggs F2 Generation 1⁄2 CR CR CR CR CW 1⁄2 Cw CR CW CW CW Figure 14.10 Incomplete dominance in snapdragon color
Table 14.2 Determination of ABO Blood Group by Multiple Alleles
BbCc BbCc Sperm 1⁄4 bC 1⁄4 Bc 1⁄4 BC bc 1⁄4 Eggs 1⁄4 BBCC BbCC BbCc BC BBCc 1⁄4 bC BbCC bbCC bbCc BbCc 1⁄4 BBcc BBCc BbCc Bbcc Bc bbcc Bbcc BbCc 1⁄4 bbCc bc 4⁄16 9⁄16 3⁄16 Figure 14.11 An example of epistasis
AaBbCc AaBbCc aabbcc Aabbcc AABBCc AABBCC AaBbcc AaBbCc AABbCc 20⁄64 15⁄64 Fraction of progeny 6⁄64 1⁄64 Figure 14.12 A simplified model for polygenic inheritance of skin color
First generation (grandparents) ww ww Ww Ww Ff Ff ff Ff Second generation (parents plus aunts and uncles) ww Ww Ww ww Ww Ff ww ff Ff FF or Ff Ff ff Third generation (two sisters) ff FF or Ff WW or Ww ww No Widow’s peak Free earlobe Widow’s peak Attached earlobe (a) Dominant trait (widow’s peak) (b) Recessive trait (attached earlobe) Figure 14.14 Pedigree analysis
Figure 14.16 Large families as excellent case studies of human genetics
(b) Chorionic villus sampling (CVS) (a) Amniocentesis Amniotic fluid withdrawn A sample of chorionic villus tissue can be taken as early as the 8th to 10th week of pregnancy. A sample of amniotic fluid can be taken starting at the 14th to 16th week of pregnancy. Fetus Fetus Suction tube Inserted through cervix Centrifugation Placenta Chorionic viIIi Placenta Uterus Cervix Fluid Fetal cells Fetal cells Biochemical tests can be Performed immediately on the amniotic fluid or later on the cultured cells. Biochemical tests Karyotyping and biochemical tests can be performed on the fetal cells immediately, providing results within a day or so. Several weeks Several hours Fetal cells must be cultured for several weeks to obtain sufficient numbers for karyotyping. Karyotyping Figure 14.17 Testing a fetus for genetic disorders
George Arlene Sam Ann Michael Sandra Wilma Tom Carla Alan Tina Daniel Christopher Unnumbered Figure p.273