Download
1 / 1
10 likes | 111 Vues
Elevation-dependent Trends in Precipitation during NAME Angela K. Rowe, Steven A. Rutledge, and Timothy J. Lang Colorado State University, Fort Collins, Colorado. Guasave. S-Pol. Cabo. MOTIVATION

E N D
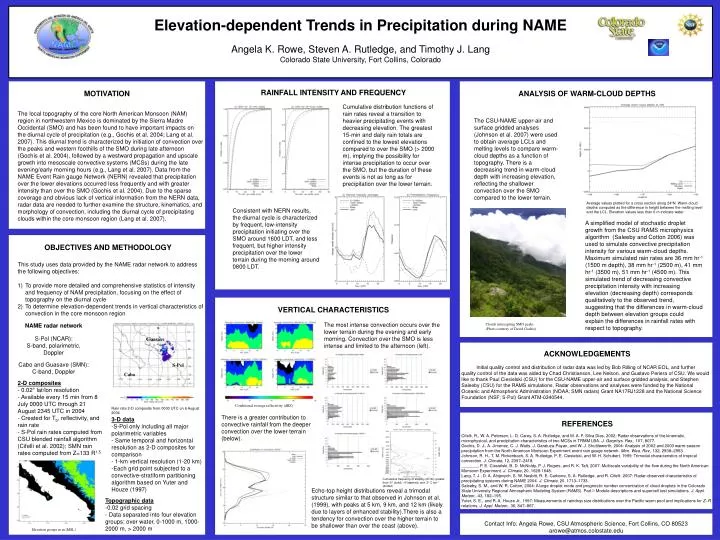
Elevation-dependent Trends in Precipitation during NAME Angela K. Rowe, Steven A. Rutledge, and Timothy J. Lang Colorado State University, Fort Collins, Colorado Guasave S-Pol Cabo • MOTIVATION • The local topography of the core North American Monsoon (NAM) region in northwestern Mexico is dominated by the Sierra Madre Occidental (SMO) and has been found to have important impacts on the diurnal cycle of precipitation (e.g., Gochis et al. 2004; Lang et al. 2007). This diurnal trend is characterized by initiation of convection over the peaks and western foothills of the SMO during late afternoon (Gochis et al. 2004), followed by a westward propagation and upscale growth into mesoscale convective systems (MCSs) during the late evening/early morning hours (e.g., Lang et al. 2007). Data from the NAME Event Rain gauge Network (NERN) revealed that precipitation over the lower elevations occurred less frequently and with greater intensity than over the SMO (Gochis et al. 2004). Due to the sparse coverage and obvious lack of vertical information from the NERN data, radar data are needed to further examine the structure, kinematics, and morphology of convection, including the diurnal cycle of precipitating clouds within the core monsoon region (Lang et al. 2007). RAINFALL INTENSITY AND FREQUENCY ANALYSIS OF WARM-CLOUD DEPTHS Cumulative distribution functions of rain rates reveal a transition to heavier precipitating events with decreasing elevation. The greatest 15-min and daily rain totals are confined to the lowest elevations compared to over the SMO (> 2000 m), implying the possibility for intense precipitation to occur over the SMO, but the duration of these events is not as long as for precipitation over the lower terrain. The CSU-NAME upper-air and surface gridded analyses (Johnson et al. 2007) were used to obtain average LCLs and melting levels to compare warm-cloud depths as a function of topography. There is a decreasing trend in warm-cloud depth with increasing elevation, reflecting the shallower convection over the SMO compared to the lower terrain. Average values plotted for a cross section along 24ºN. Warm-cloud depths computed as the difference in height between the melting level and the LCL. Elevation values less than 0 m indicate water. Consistent with NERN results, the diurnal cycle is characterized by frequent, low-intensity precipitation initiating over the SMO around 1600 LDT, and less frequent, but higher intensity precipitation over the lower terrain during the morning around 0800 LDT. A simplified model of stochastic droplet growth from the CSU RAMS microphysics algorithm (Saleeby and Cotton 2006) was used to simulate convective precipitation intensity for various warm-cloud depths. Maximum simulated rain rates are 36 mm hr-1 (1500 m depth), 38 mm hr-1 (2500 m), 41 mm hr-1 (3500 m), 51 mm hr-1 (4500 m). This simulated trend of decreasing convective precipitation intensity with increasing elevation (decreasing depth) corresponds qualitatively to the observed trend, suggesting that the differences in warm-cloud depth between elevation groups could explain the differences in rainfall rates with respect to topography. • OBJECTIVES AND METHODOLOGY • This study uses data provided by the NAME radar network to address the following objectives: • To provide more detailed and comprehensive statistics of intensity and frequency of NAM precipitation, focusing on the effect of topography on the diurnal cycle • To determine elevation-dependent trends in vertical characteristics of convection in the core monsoon region VERTICAL CHARACTERISTICS The most intense convection occurs over the lower terrain during the evening and early morning. Convection over the SMO is less intense and limited to the afternoon (left). Clouds intercepting SMO peaks (Photo courtesy of David Gochis) NAME radar network S-Pol (NCAR): S-band, polarimetric, Doppler Cabo and Guasave (SMN): C-band, Doppler ACKNOWLEDGEMENTS Initial quality control and distribution of radar data was led by Bob Rilling of NCAR EOL, and further quality control of the data was aided by Chad Christianson, Lee Nelson, and Gustavo Periera of CSU. We would like to thank Paul Ciesielski (CSU) for the CSU-NAME upper-air and surface gridded analysis, and Stephen Saleeby (CSU) for the RAMS simulations. Radar observations and analyses were funded by the National Oceanic and Atmospheric Administration (NOAA; SMN radars) Grant NA17RJ1228 and the National Science Foundation (NSF; S-Pol) Grant ATM-0340544. • 2-D composites • 0.02° lat/lon resolution • Available every 15 min from 8 July 0000 UTC through 21 August 2345 UTC in 2004 • Created for Tb, reflectivity, and rain rate • S-Pol rain rates computed from CSU blended rainfall algorithm (Cifelli et al. 2002); SMN rain rates computed from Z=133 R1.5 Conditional average reflectivity (dBZ) Rain rate 2-D composite from 0000 UTC on 6 August 2004 REFERENCES Cifelli, R., W. A. Petersen, L. D. Carey, S. A. Rutledge, and M. A. F. Silva Dias, 2002: Radar observations of the kinematic, microphysical, and precipitation characteristics of two MCSs in TRMM LBA. J. Geophys. Res., 107, 8077. Gochis, D. J., A. Jimenez, C. J. Watts, J. Garatuza-Payan, and W. J. Shuttleworth, 2004: Analysis of 2002 and 2003 warm-season precipitation from the North American Monsoon Experiment event rain gauge network. Mon. Wea. Rev., 132, 2938–2953. Johnson, R. H., T. M. Rickenbach, S. A. Rutledge, P. E. Ciesielski, and W. H. Schubert, 1999: Trimodal characteristics of tropical convection. J. Climate, 12, 2397–2418. _______, P. E. Ciesielski, B. D. McNoldy, P. J. Rogers, and R. K. Taft, 2007: Multiscale variability of the flow during the North American Monsoon Experiment. J. Climate, 20, 1628-1648. Lang, T. J., D. A. Ahijevych, S. W. Nesbitt, R. E. Carbone, S. A. Rutledge, and R. Cifelli, 2007: Radar-observed characteristics of precipitating systems during NAME 2004. J. Climate, 20, 1713–1733. Saleeby, S. M., and W. R. Cotton, 2004: A large droplet mode and prognostic number concentration of cloud droplets in the Colorado State University Regional Atmospheric Modeling System (RAMS). Part I: Module descriptions and supercell test simulations. J. Appl. Meteor., 43, 182–195. Yuter, S. E., and R. A. Houze Jr., 1997: Measurements of raindrop size distributions over the Pacific warm pool and implications for Z–R relations. J. Appl. Meteor., 36, 847–867. There is a greater contribution to convective rainfall from the deeper convection over the lower terrain (below). • 3-D data • S-Pol only including all major polarimetric variables • Same temporal and horizontal resolution as 2-D composites for comparison • 1-km vertical resolution (1-20 km) • Each grid point subjected to a convective-stratiform partitioning algorithm based on Yuter and Houze (1997) Cumulative frequency of stability (dT/dz) greater than -5° (solid), -4°(dashed), and -3° C km-1 (dotted) Echo-top height distributions reveal a trimodal structure similar to that observed in Johnson et al. (1999), with peaks at 5 km, 9 km, and 12 km (likely due to layers of enhanced stability).There is also a tendency for convection over the higher terrain to be shallower than over the coast (above). • Topographic data • 0.02 grid spacing • Data separated into four elevation groups: over water, 0-1000 m, 1000-2000 m, > 2000 m Contact Info: Angela Rowe, CSU Atmospheric Science, Fort Collins, CO 80523 arowe@atmos.colostate.edu Elevation groups in m (MSL)