Download
1 / 31
310 likes | 343 Vues
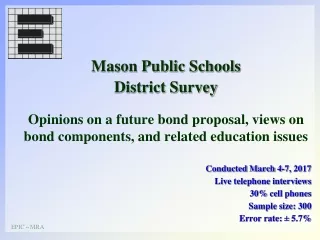
This survey conducted in March 2017 provides insights into the opinions of Mason Public Schools district residents regarding a future bond proposal, including views on bond components and related education issues.

E N D
Mason Public Schools District Survey Opinions on a future bond proposal, views on bond components, and related education issues Conducted March 4-7, 2017 Live telephone interviews 30% cell phones Sample size: 300 Error rate: ± 5.7%
How many respondents in sample participated in May 2016 election? • Voted in election 78% • DID NOT vote 18% • Unsure/Refused 4% All Parents: 81% voted MS Parents: 84% voted Non-Parents: 77% voted
Vote results on May 2016 bond election 44% Voted Yes46% Voted No 4% Cannot remember6% Refused/DK All Parents: 60% Yes vs 30% No 10% Ref/Can’t remember MS Parents: 58% Yes vs 30% No 12% Ref/Can’t remember Non-Parents: 41% Yes vs 51% No 8% Ref/Can’t remember
If non-voters participated, how would they have voted on May 2016? 41% Voted Yes 26% Voted No 33% Unsure/Refused N–size too small for analysis of “parents”
Pro Education/Schools/Always votes “Yes”: 30% Building/facility improvements/upgrades: 19% Funding is needed: 10% Improve education quality: 9% Improvements are needed: 7% New building needed/district overcrowding: 5% Technology: 5% Have/know students: 4% Important for community growth: 3% Personal experience with/in schools: 3% Other responses of 1% or less: 8% Why respondents voted/would have voted “YES” on May 2016
Tax increase/taxes are too high: 30% Too much money: 12% Need more information/details: 10% Wasteful spending: 9% Too much at once: 7% Against new buildings: 5% Should maintain existing buildings/facilities: 4% Improvements not needed: 3% Recent athletics bond proposal: 3% Unused/closed buildings: 3% Funding not needed: 2% Grade restructuring: 2% Superintendent is poor: 2% Other responses of 1% or less: 8% Why respondents voted/would have voted “NO” on May 2016
First vote on bond proposal up to $80 million – 3.45 mills – 30 years • Vote “Yes” 38% • Lean “Yes” 7% • Total YES vote 45% • Vote “No” 39% • Lean “No” 5%Total NO vote 44% • Undecided 11% All Parents: 67 to 22% “Yes” MS Parents: 65 to 24% “Yes” Non-Parents: 48 to 40% “No”
Pro Education/Schools/Always votes “Yes”: 22% Building/facility improvements/upgrades: 18% Funding is needed: 14% Improvements are needed: 8% Improve education quality: 7% Reasonable cost: 7% Technology: 7% Important for community growth: 4% Personal experience with/in the schools: 4% New building needed/district overcrowding: 3% Athletics: 2% Other responses of 1% or less: 4% Reasons for voting “YES” - 1st vote on $80 million bond proposal
Tax increase/taxes are too high: 37% Wasteful spending: 15% Too much money: 12% Need more information/details: 9% Against new buildings: 5% Unused/closed buildings: 4% Funding is not needed: 2% Quality of education provided is poor: 2% Recent athletics bond proposal: 2% Should maintain existing buildings/facilities: 2% Teachers underpaid: 2% Technology will be outdated before bond repaid: 2% Too much at once: 2% Voted No before: 2% Other responses of 1% or less: 5% Reasons for voting “NO” - 1st vote on $80 million bond proposal
Respondents oppose moving 5th graders to expanded middle school • Strongly favor 14% • Smwt favor 23% • Total FAVOR 37% • Smwt oppose 14% • Strongly oppose 25% • Total OPPOSE 39% • Undecided 24% All Parents: 45 to 36% Favor MS Parents: 41 to 39% Oppose Non-Parents: 39 to 36% Oppose
More oppose moving 5th graders to middle school after arguments • Strongly favor 13% • Smwt favor 23% • Total FAVOR 36% • Smwt oppose 21% • Strongly oppose 28% • Total OPPOSE 49% • Undecided 15% All Parents: 53 to 40% Oppose MS Parents: 59 to 33% Oppose Non-Parents: 48 to 36% Oppose
Respondents favor moving kindergarten students to Harvey Center • Strongly favor 28% • Smwt favor 29% • Total FAVOR 57% • Smwt oppose 9% • Strongly oppose 17% • Total OPPOSE 26% • Undecided 17% All Parents: 62 to 24% Favor MS Parents: 63 to 24% Favor Non-Parents: 55 to 26% Favor
Support for moving kindergarten students to Harvey unchanged after hearing arguments • Strongly favor 27% • Smwt favor 29% • Total FAVOR 56% • Smwt oppose 12% • Strongly oppose 18% • Total OPPOSE 30% • Undecided 14% All Parents: 62 to 28% Favor MS Parents: 63 to 25% Favor Non-Parents: 54 to 30% Favor
Plurality favors renovating and expanding elementary schools • Strongly favor 26% • Smwt favor 23% • Total FAVOR 49% • Smwt oppose 15% • Strongly oppose 16% • Total OPPOSE 31% • Undecided 20% All Parents: 57 to 29% Support MS Parents: 57 to 29% Support Non-Parents: 47 to 32% Support
Solid majority opposes moving 4th & 5th graders into Harvey Center • Strongly favor 5% • Smwt favor 17% • Total FAVOR 22% • Smwt oppose 20% • Strongly oppose 41% • Total OPPOSE 61% • Undecided 17% All Parents: 69 to 26% Oppose MS Parents: 69 to 25% Oppose Non-Parents: 58 to 21% Oppose
Solid majority opposes moving kindergarten students to Harvey/ 5th graders to Middle School • Strongly favor 8% • Smwt favor 14% • Total FAVOR 22% • Smwt oppose 17% • Strongly oppose 47% • Total OPPOSE 64% • Undecided 14% All Parents: 69 to 28% Oppose MS Parents: 69 to 27% Oppose Non-Parents: 63 to 21% Oppose
Narrow majority opposes moving 4th & 5th graders into expanded Steele Elementary School • Strongly favor 10% • Smwt favor 24% • Total FAVOR 34% • Smwt oppose 18% • Strongly oppose 33% • Total OPPOSE 51% • Undecided 15% All Parents: 53 to 47% Oppose MS Parents: 53 to 47% Oppose Non-Parents: 50 to 31% Oppose
Majority opposes moving 4th & 5th graders into expanded new intermediate school at new location • Strongly favor 14% • Smwt favor 19% • Total FAVOR 33% • Smwt oppose 18% • Strongly oppose 36% • Total OPPOSE 54% • Undecided 13% All Parents: 48 to 47% Support MS Parents: 49 to 45% Support Non-Parents: 56 to 30% Oppose
1st & 2nd choice options for addressing overcrowding problem in elementary schools
Technology upgrades would provide teachers and students with additional computers and devices, multimedia components and infrastructure, and expanded wireless capacity, at a cost of $4.7 million dollars. 75% Total Support (45% Strong Support) – 19% opposed HVAC improvements would be made at all buildings including new boilers, air conditioning and temperature control systems. 74% Total Support (45% Strong Support) – 17% opposed Improvements supported by the highest to lowest percentages
The proposal includes improvements intended to make all schools safe and secure, such as more secure entrances at all schools, upgraded sidewalks, parking and site improvements, playgrounds, vehicle traffic route renovations and pedestrian traffic upgrades, as well as the replacement of aging school buses. The cost of these improvements will be $6.25 million dollars. 72% Total Support (41% Strong Support) – 16% opposed At Mason Middle School, other upgrades would convert large group class rooms into science labs, renovation of the wood shop, robotics and STEM labs, and in Mason High School, science classes relocated to industrial arts space, a new wood shop, STEM and robotics labs, and an athletic multi-purpose addition built, at a cost of $16.6 million dollars. 56% Total Support (30% Strong Support) – 29% opposed Improvements supported by the highest to lowest percentages (cont.)
2nd vote on $80 million bond - after features described and judged • Vote “Yes” 50% • Lean “Yes” 9% • Total YES vote 59% • Vote “No” 27% • Lean “No” 5%Total NO vote 32% • Undecided 9% All parents: 74 to 21% “Yes” MS parents: 73 to 22% “Yes” Non-parents: 56 to 34% “Yes”
43%: Solid “yes” voters on both questions 30%: Solid “no” voters on both questions 4%: Solid “undecided” voters on both questions 16%: Moved toward voting “yes” 1%: Moved toward voting “no” 5%: Moved toward “undecided” Comparing first and second votes on the $80 million bond
29%: Unsure about managing finances 28%: Someone else a union member 27%: Gets info from TV 6 26%: Refused to say how they voted in May 23%: Half time/seldom voters; voted “no” in May; men age 18-49 22%: Lived in Mason 10 years or less; women without college 21%: Most of the time odd-year voters; women age 50+ 20%: Favored moving kindergarten students to Harvey; favored expanding existing elementary schools; age 18-34 19%: Somewhat certain/will probably vote; neg rating managing finances; info from word-of-mouth; lifetime res; women 18%: Votes at polls; A&B grade; taxes about right; Did not vote in May; info from LSJ; no children; HS or less; age 18-49 17%: Positive rating on schools; unsure about moving kindergarten students to Harvey; info from other parents; age 35-49 Groups moving toward voting “yes” by more than 16%
Vote on scaled back $68.5 million bond – 2.88 mill increase • Vote “Yes” 49% • Lean “Yes” 10% • Total YES vote 59% • Vote “No” 27% • Lean “No” 5%Total NO vote 32% • Undecided 9% All parents: 71 to 22% “Yes” MS parents: 73 to 22% “Yes” Non-parents: 56 to 34% “Yes”
Vote on scaled back $61.1 million bond – 2.48 mill increase • Vote “Yes” 51% • Lean “Yes” 10% • Total YES vote 61% • Vote “No” 27% • Lean “No” 4%Total NO vote 31% • Undecided 8% All parents: 74 to 19% “Yes” MS parents: 75 to 18% “Yes” Non-parents: 58 to 33% “Yes”
Letter grades for Mason Schools providing a quality education • A grade 28% • B grade 44% A&B Total 72% • C grade 9% • D grade 3% • F grade 1%D&F Total 4%Unsure 15% All Parents: 76% A&B 16% C - 5% D&F MS Parents: 80% A&B 14% C - 6% D&F Non-Parents: 71% A&B 8% C - 3% D&F
Concern about level of school taxes in Mason Public Schools • 8% Much too high • 11% Somewhat too high • 19% Total Too High • 63% About right • 8% Too low • 10% Unsure All Parents: 14% Too high MS Parents: 14% Too high Non-Parents: 20% Too high
Job rating for Mason Schools managing district finances • Excellent 14% • Pretty good 44% • Total POSITIVE 58% • Just fair 23% • Poor 6%Total NEGATIVE 29% • Undecided 13% All Parents: 60%-31% Positive MS Parents: 63%-29% Positive Non-Parents: 58%-28% Positive
Rating for the condition of buildings, facilities, grounds and property owned and operated by Mason Public Schools • Excellent 20% • Pretty good 57% • Total POSITIVE 71% • Just fair 19% • Poor 4%Total NEGATIVE 23% • Undecided 6% All Parents: 50 to 48% Negative FS Parents: 51 to 49% Negative Non-Parents: 76 to 16% Positive
General word-of-mouth: 16% Lansing State Journal: 13% Community News: 12% Keynotes Newsletter/notes/flyers/info from district: 8% Own children/other students: 7% Other parents with children in the district: 6% TV news reports on TV 6/WLNS: 5% Board of education members/meetings: 4% Teachers/parent-teacher conferences: 4% TV news reports on TV 10/WILX: 3% Mason Bond Info website: 2% School district administrators: 2% None/no source of information: 1% Online in general: 1% Radio news reports: 1% Other responses of 1% or less: 1% Where respondents get information about Mason Public Schools