Download
1 / 16
160 likes | 341 Vues
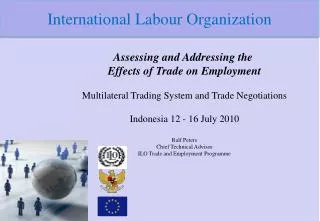
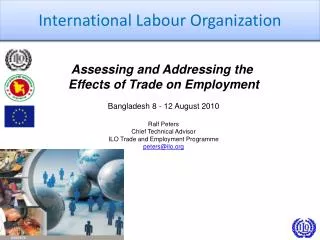
International Labour Organization. Assessing and Addressing the Effects of Trade on Employment Trade Structure and Trade Policy Indonesia 12 - 16 July 2010 Ralf Peters Chief Technical Advisor ILO Trade and Employment Programme peters@ilo.org.

E N D
International Labour Organization Assessing and Addressing the Effects of Trade on Employment Trade Structure and Trade Policy Indonesia 12 - 16 July 2010 Ralf Peters Chief Technical Advisor ILO Trade and Employment Programme peters@ilo.org
Total merchandise trade value ('000 USD), 1980-2009 Exports and imports increased by 600 per cent during the last 2 decades (nominal) Exports exceed imports: trade balance + US$ 20 bill. (merchandise 12 month, Apr. 2010) Exports peaked at US$ 136 bill. in 2008 and dropped by 15 per cent in 2009 Exports account for 30% of GDP (2007) Impressive but not all supplysidedriven
Export values over time and by region, 1980-2009 ('000 USD) Increase in exports mainly due to increase in exports to East and Southeast Asia (about 60%, of this 22% Japan) Exports to EU and US increased as well Also dynamic: South Asia and Middle East and N. Africa Less dynamic: Latin America Developing countries important markets
Import values over time and by region, 1980-2009 ('000 USD) Also imports increased mostly from East and Southeast Asia
Indonesian average trade value by regional destination, 1980-2009 ('000 USD) Most trade with East and Southeast Asia Trade with China increasing Average exports US$ 32 bill., imports US$ 21 bill. EU and US also large trading partners
Export Structure in Indonesia, 1980 and 2009 Export share of mineral fuels and lubricants decreased • Export share increased for • animal and veg. oil and fats • chemicals • manufactures • machinery and transport equip. • misc. manufactures Successful diversification
Export shares by selected industry, 1980 - 2009 Dominance of mineral fuels and lubricants exports decreased mainly between 1982 to 1998 Why was that? • Price effect • Volume effect • Other goods exports increased
Import Structure in Indonesia, 1980 and 2009 No significant change of import structure Main import item Manufactures
Indonesian trade in services with the world, 2000-2008 Services traded is significantly smaller than merchandise trade (between 10 to 20 % of merchandise trade; in line with world trade structure) Imports are higher than exports Services accounts for 40% of GDP
Service exports by type, 2004-2008 Travel is largest component of services exports Grew to US$ 7 bill. in 2008
Service imports by type, 2004-2008 Transportation is largest component of services imports Transportation, travel and other business & royalties dominate imports clearly
Trade Policy • Tariffs remain Indonesia’s main trade policy instrument • More than 75% of tariffs between 0 and 10% • Peak tariffs apply to motor vehicles, chemicals, fabricated metal products, bicycles, alcohol products • Some degree of tariff escalation: e.g. semi-processed food • Indonesia’s ASEAN average Common Effective Preferential Tariff CEPT: 2.7 per cent (2006)
Bound and applied tariff rate, tariff year 2009 Indonesia Indonesia has a lot of “water in the tariff”, i.e. average bound rate is much higher than applied rate Developing Countries From import substitution to export orientation Developed Countries
Non-tariffmeasures • Bans for chicken-parts, rice and salt (e.g. for sanitary reasons) • Producer import licences (e.g. sugar imports) • Government procurement instrument of industrial policy (not signatory to Agreement on GP) • Active user of anti-dumping measures mainly on base metals and chemicals form the region • Example of import ban in 2004: Domestic rice price 30 per cent above world market price
Trade Negotiations: triple trackapproach • Multilateral track at WTO • Regional track: ASEAN and ASEAN+ • Bilateral (new): e.g. Japan • Government has established a National Trade Negotiation Team
Indonesian export shares of AFTA vs. Non-AFTA members, 1980-2009 20 per cent of Indonesia’s exports to ASEAN countries Intra-ASEAN trade relatively high for south-south RTA