Download
1 / 28
280 likes | 392 Vues
This report explores the utilization of ethanol co-products, specifically dried distillers grains (DGS), in beef cattle production. It discusses their impact on nutrient management, particularly phosphorus (P) levels, and the public policy implications surrounding nutrient flows from livestock operations. The analysis considers the efficient use of manure nutrients, the economic factors of feeding DGS, and the environmental risks associated with nutrient runoff. The findings highlight the necessity of balancing beef production with sustainable nutrient management practices.

E N D
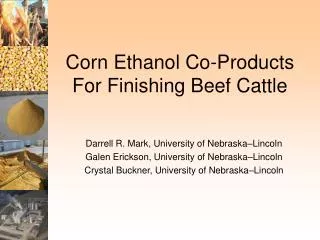
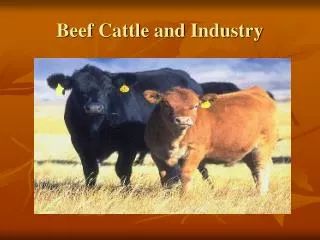
Ethanol Co-Product Utilization and its impact on the environment -beef cattle Rick Koelsch & Galen Erickson
Manure P vs. Crop Land P Use < 25% 25 - 50% 50 - 100% >100%
< 25% 25 - 50% 50 - 100% >100% One-Way Flow of Nutrients Is Underlying Cause
Public Policy Response • Nutrient Management Plan • Use manure nutrients efficiently within the land base managed by the livestock operation. • Phosphorus Risk Assessment – • Potential for P to move from land application site • Based upon “source” and “transport” factors • Preference to imported commercial nutrients over recycled manure nutrients.
DRY MILLING-WDG(+S) GRAIN GRIND, WET, COOK Abengoa Bioenergy, York, NE FERMENTATION YEAST, ENZYMES STILL ALCOHOL & CO2 STILLAGE DISTILLERS GRAINS WDG, DDG DISTILLERS SOLUBLES WDGS DDGS
Performance for DGS Vander Pol et al., 2006 Nebraska Beef Rep. and 2005 Midwest ASAS
Economics for WDGS -$143.19 Corn at $3.50/bu; WDGS at 95% of corn price; miles are distance from ethanol plant to feedlot
Beef Extension Page http://beef.unl.edu Beef Reports
Intake Retained nutrients 10-15% Excretion Intake-Retention=Excretion Excretion in feces & urine
Impact of DGS on excretion • Excretion numbers using ASABE std approach • AVG MIN MAX • Diet P, % 0.31 0.25 0.50* • P Excretion 7.0 lb 4.6 lb 14.1 lb • “old” std 13.9 lb • Diet CP, % 13.3 12.0 20.5* • N Excretion 64 lb 57 lb 104 lb • 150 days fed for an "average" steer
Impact of DGS on N challenge N mass balance P<0.01 P<0.01 P<0.01 P=0.07
Impact of DGS on P challenge Dietary P in Feedlot Diets .59 .52 .35 .27 NRC
Impact of DGS on P challenge Dietary P in Feedlot Diets .59 .52 .35 .27 NRC Our data
Impact of DGS on P challenge Dietary P effect on manure Relationship between P intake and manure harvested P (kg/hd/d) for cattle lots. Kissinger et al., 2006 NE Beef Report
1. Base Scenario (Corn Diet) Traditional Corn Based Diet 10,000 head feedlot 13% CP and 0.29% P Diet Corn/soybeans crop rotation 40% land availability for spreading Manure applied at 4-year phosphorus rate Spread with 20 ton truck spreaders
1. Base Scenario (Corn Diet) (1) N (#/yr) 1,095,000 P (#/yr) 134,000 Acres 5,800 Time (hr) 910 Haul (mi) 2.0 Value $108,000 Cost $52,000
40% WDGS Scenario 40% WDGS Diet 10,000 head feedlot 18.7% CP and .49% P Diet Corn/soybeans crop rotation 40% land availability for spreading Manure applied at 4-year phosphorus rate Spread with 20 ton truck spreaders
2. 40% WDGS Scenario (1) (2) N (#/yr) 219,000 331,000 P (#/yr) 127,000 243,000 Acres 5,800 11,100 Time (hr) 910 1,000 – 1,300 Haul (mi) 2.0 2.9 Value $108,000 $192,000 Cost $52,000 $59,000 to $72,000 Can I afford 100 to 400 hours added labor? and $7,000 to $23,000 higher costs? Can I find 5,400 acres?
Summary of Economic Factors…0 vs. 40% Inclusion of DGs • Costs of DGS use: • $7,000 to $24,000 to manure application costs • 100 to 350 hours to labor & equipment requirements • 5,700 acres to land access requirements • Benefits of DGS use: • $83,000 in gross manure nutrient value • $150,000 to $300,000 in reduced feed costs * 10,000 head beef feedlot (40% land available)
Impact of DGS on P challenge Land Requirements, 4yr P basis (acres) Feedlot size (hd): 2500 10,000 25,000 0 byp 0.30 P 1,320 5,300 13,200 20 byp 0.40 P 1,900 7,600 19,000 40 byp 0.50 P 2,500 10,000 25,000 Assumes: 50% of land area accessible 185 bu corn, corn-soybean rotation, ~35 lb P per acre (80 lb P2O5) Kissinger et al., 2006 NE Beef Report
Manure P vs Fertilizer P • 79% of corn acres fertilized in 2003 • average = 35 lb/ac • 8.1 million acres planted • (141,750 tons P2O5) • (54,871 tons P at 79% acres) • 4.5 million feedlot cattle • Excrete 12 lb = 54 mil. Lb. • (27,000 tons) http://www.nass.usda.gov/ne/special/agchem04.pdf
Whole Farm P Balance No DG Inclusion 40% DG Inclusion
Implications of Greater P Inputs • P Inventory within farm increases at rate of 88,000 vs 180,000 lb P/year faster. • Short Term - P Risk Assessment will… • Erosion control practices will allow banking of excess P for some period of time… • Bank will be filled more quickly with DGS. • Long Term - P Risk Assessment will… • Reduce fields receiving manure to meet N needs • Increase fields receiving manure to meet P needs • Increase fields ineligible for manure application
Summary • DGS are economical for feeding • DGS supply is dramatically increasing • Feeding DGS increases P excretion (manure) • Feeding DGS increases N volatilization • Use of DGS increases acres and cost • But, manure value increased • Nebraska opportunity (have acres) • Manure distribution challenges
Research Opportunities? • Remove P from DGS, Remove N from DGS • Value manure over fertilizer nutrients • Reduce/End N volatilization • Reduce manure nuisance issues • Develop alternative technologies for separating nutrients • Reduce bio-availability of P to plants • Low P corn, but mass balance issue
Public Policy Needs • Value recycled manure over imported fertilizer nutrients • Encourage export of manure • Encourage alternative uses of manure • Recognize environmental benefits of manure • Cautiously apply P-Index triggers for “No Manure” application. • Recognize critical differences in nutrient plans for cattle operations based upon DGS use.