Download
1 / 21
210 likes | 371 Vues
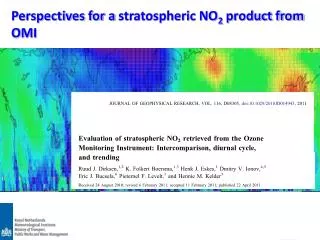
Perspectives for a stratospheric NO 2 product from OMI. Dutch OMI NO 2 algorithm: data assimilation. TM4. NO 2 in TM4 updated by OMI observations Observations over polluted areas obtain little weight ECMWF meteo captures stratospheric dynamics. Validation of OMI stratospheric NO 2.

E N D
Dutch OMI NO2 algorithm: data assimilation TM4 • NO2 in TM4 updated by OMI observations • Observations over polluted areas obtain little weight • ECMWF meteo captures stratospheric dynamics
Validation of OMI stratospheric NO2 • Independent data • NDACC • SAOZ • Remote locations • Techniques • - Twilight DOAS • - Errors: radiative transfer, time adjustment (~20%) • - Direct Sun FTIR • - Errors: a priori profiles, X-section (~30%)
SZA=90 AMF18 SAOZ SAOZ data Scoresby Celarier et al. [2008] OMI overpass Chemical box-model (SLIMCAT) converts twilight measurements to column value close to OMI overpass
Intercomparison SAOZ & FTIR Sodankyla: very good agreement Jungfraujoch: reasonable after Demoulin replaced FTIR polluted a priori NO2 profile with AFGL Izana: modest due to (Gil) “problems in illumination of the detector and stray light wrongly estimated” Improved Izana SAOZ-data: +15% Better match with FTIR and OMI
Bias < 1×10¹⁵ molec.cm-2 RMS < 13% DOMINO > SP Seasonal bias? Evaluation of OMI stratospheric NO2 data • DOMINO • Standard Product
Evaluation of OMI stratospheric NO2 data Average over all ground-based techniques
Evaluation of other KNMI stratospheric NO2data Hendrick et al, ACP, 2012
Evaluation of other KNMI stratospheric NO2data Hendrick et al, ACP, 2012
Preliminary conclusions • Jungfraujoch: KNMI GOME(-2), SCIAMACHY: no bias • Jungfraujoch: DOMINO v1+0.5 1015molec. cm-2 • *** conclusions for version 1 (2010) *** • |SP – ground| < 0.2 ×10¹⁵ molec.cm-2 • |DP – ground| < 0.3 ×10¹⁵ molec.cm-2 Can we learn anything from these data?
FTIR DOMINO SP Standard Product (wave fitting to 24-hr data composite) Day-to-day variability MARCH 2005 9 12 14 17 21 DOMINO captures collapse of polar vortex
Total Ozone DOMINO SP Pot. Vorticity Temperature 9 12 14 17 21
Diurnal variation • Use OMI’s wide swath: multiple overpasses per day • Infer stratospheric increase rate 70 N OMI observes diurnal increase in stratospheric NO2
Annual periodicity Annual periodicity QBO Vortex Vortex Vortex Vortex Vortex Trends in OMI stratospheric NO2
Trends in OMI stratospheric NO2 NH SH Mid-latitudes: trend dominated by seasonality Tropics: trend dominated by Quasi-Biennual Oscillation (QBO) QBO: oscillation (23-34 months) in equatorial zonal winds modulates vertical transport of NOy in Tropics
Stratospheric NO2 [1015 molec/cm2] Trends in OMI stratospheric NO2 Fitting model: Offset + linear trend + 4,6,12 month harmonic term + QBO QBO: index (NCEP) and composite of 18, 24, 30 month-harmonics
Trends in OMI stratospheric NO2 Fitting model: same (no ENSO, no 11-yr Solar Cycle)
When can we detect long-term trends? Lauder NDACC station 1981-1999 +6 %/decade Liley et al.: +5%/decade Fit model: Offset Trend 4,6,12 month harmonics QBO Solar Index ENSO El Chicon & Pinatubo After Liley et al. 2000
When can we detect long-term trends? Lauder NDACC station 2000-2010 -6 %/decade Trend depends on period considered Not possible to establish effect of N2O trend on NO2
Trends over Lauder: ground-based vs. OMI NDACC: +3%/decade OMI: +1%/decade Variability in summer maxima Satellite observations complement ground-based data record Need longer records: include GOME, SCIAMACHY, and GOME-2
Summary and outlook • Satellite observations complement ground-based data record in monitoring stratospheric NO2 • For long-term trend analyses: need longer records • include GOME(-2) & SCIAMACHY • Test stratospheric CTMs: • Day-to-day variability in stratospheric NO2 associated with stratospheric wave activity • Diurnal variation of stratospheric NO2 • QBO and trends