WORKERS COMPENSATION - CURRENT ISSUES - (SESSION WC-3)
WORKERS COMPENSATION - CURRENT ISSUES - (SESSION WC-3). Barry Lipton, FCAS, MAAA – NCCI Nancy Treitel, FCAS, MAAA – Liberty Mutual. Casualty Actuarial Society 2004 Seminar on Ratemaking Philadelphia, Pennsylvania March 11-12, 2004.

WORKERS COMPENSATION - CURRENT ISSUES - (SESSION WC-3)
E N D
Presentation Transcript
WORKERS COMPENSATION- CURRENT ISSUES -(SESSION WC-3) Barry Lipton, FCAS, MAAA – NCCI Nancy Treitel, FCAS, MAAA – Liberty Mutual Casualty Actuarial Society 2004 Seminar on Ratemaking Philadelphia, Pennsylvania March 11-12, 2004
WC Premium Growth Leads Most Other LinesNet Written Premium by Line Source: Best’s Aggregates & Averages, Review/Preview (Includes state funds for: AZ, CA, ID, LA, MD, ME, MN, OR, RI, TX, and UT) © 2004 National Council on Compensation Insurance, Inc.
Combined Ratios Improved in 2003 Net Combined Ratios Source: Best’s Aggregates & Averages, Review/Preview (Includes state funds for: AZ, CA, ID, LA, MD, ME, MN, OR, RI, TX, and UT) © 2004 National Council on Compensation Insurance, Inc.
Return on Equity for Total P&C Appears In Line With Other IndustriesEstimated 2003 After-Tax ROE for Public Companies Source: Value-Line, latest estimates as of 1/2004. P/C projected 2003 ROS from Best’s Review/Preview. © 2004 National Council on Compensation Insurance, Inc.
Workers Compensation Premium VolumeContinues to GrowWorkers Compensation Net Written Premium $ Billions $ Trillions Source: Best’s Aggregates & Averages, Review/Preview; Economy.com © 2004 National Council on Compensation Insurance, Inc.
Large Deductible Growth ContinuesCalendar Year WC Premiums & Premium EquivalentsNCCI States Source: NCCI Large Deductible study © 2004 National Council on Compensation Insurance, Inc.
Calendar Year WC Loss Ratio Showing Slight ImprovementWorkers Compensation Net Loss Ratios 1.9 % Due to September 11th. Source: Best’s Aggregates & Averages, Review/Preview; 9-11 est. from NCCI © 2004 National Council on Compensation Insurance, Inc.
WC Loss Ratios - Impact of Large Deductible Policies First Large DollarDeductible Loss $ 75 $ 15 Expense $ 25$ 23 Premium $100 $ 38 Loss Ratio 75% 40% Expense Ratio 25% 60%
WC LAE Ratios to Premium Appears to Have Leveled OffWC Ratio of Loss Adjustment Expense to Net Earned Premiums Source: Best’s Aggregates & Averages, Review/Preview © 2004 National Council on Compensation Insurance, Inc.
WC LAE To Loss Ratios In Recent Years Shows Slight IncreaseWC Ratio of Loss Adjustment Expense to Losses Source: Best’s Aggregates & Averages, Review/Preview © 2004 National Council on Compensation Insurance, Inc.
WC Expense Ratios Continue Slight DeclineWC Ratio of Underwriting Expenses to NWP (Excl Divs) Source: Best’s Aggregates & Averages, Review/Preview © 2004 National Council on Compensation Insurance, Inc.
WC Dividend Ratios Continue to DeclineWC Ratio of Policyholder Dividends to Net Earned Premium Source: Best’s Aggregates & Averages, Review/Preview © 2004 National Council on Compensation Insurance, Inc.
Workers Compensation Calendar Year Combined Ratio Declined in 2003Workers Compensation Combined Ratios 1.9% Due to September 11th Source: Best’s Aggregates & Averages, Review/Preview © 2004 National Council on Compensation Insurance, Inc.
Low WC Investment Returns Continued in 2003WC Ratio of Investment Gain and OtherIncome to Premium p PreliminarySource for 1993–2002: A.M. Best Aggregates & Averages; 2003p: NCCI estimate based on data in Best’s Review/Preview Investment gain includes investment income on insurance transactions and realized capital gains. © 2004 National Council on Compensation Insurance, Inc.
WC Results in 2003 Improved Over 2002 WC Pretax Operating Gain/Loss Ratio p PreliminarySource for 1993–2002: A.M. Best Aggregates & Averages; 2003p: NCCI estimate based on data in Best’s Review/Preview Investment gain includes investment income on insurance transactions and realized capital gains. © 2004 National Council on Compensation Insurance, Inc.
WC Calendar Year Combined Ratios Private Carriers Compared to Private Carriers + A.M. Best State Funds Combined Ratio p Preliminary (State Funds include: AZ, CA, ID, LA, MD, ME, MN, OR, RI, TX, and UT) CY 1993-2002 & PC+SF 2003p: Best’s Aggregates & Averages, Review/Preview; PC CY 2003p: NCCI estimate Includes dividends to policyholders. © 2004 National Council on Compensation Insurance, Inc.
Combined Ratio in AY 2002 Continued to Improve WC Calendar Year vs. Ultimate Accident YearCountrywide - Private Carriers Combined Ratio p PreliminaryCY 1993-2002: Best’s Aggregates & Averages; AY 1993-2002: NCCI; CY & AY 2003p: NCCI estimatesAccident year data is evaluated as of 12/31/2002 and developed to ultimate. Includes dividends to policyholders. © 2004 National Council on Compensation Insurance, Inc.
What Have Been The Key Factors Impacting Workers Compensation Results? • Carrier Reserves • Carrier Pricing • Loss Severity Trends (especially Medical) • Frequency Trends • Investments © 2004 National Council on Compensation Insurance, Inc.
Workers Compensation Reserve Strengthening ContinuesDollar Amount of Reserve Adjustments on Prior AYsWC Countrywide—Net—Private Carriers Loss and LAE reserves. © 2004 National Council on Compensation Insurance, Inc.
Reserve Releases Have Partially Offset the Upward Development on More Recent Accident Years for WCAccident Year Loss Ratios Including LAE Reserve Releases Reported Loss and LAE reserves from Schedule P. © 2004 National Council on Compensation Insurance, Inc.
ADVISORY ORGANIZATION Advisory Loss Costs Assigned Risk Rates Experience Rating Values Experience Mods Rating Plans and Classifications INSURANCE COMPANY Final Rate Determination: Expense Multiplier Loss Cost Deviations Individual Risk Modifications: Schedule Rating Retrospective Rating How Are Final WC Premiums Determined? © 2004 National Council on Compensation Insurance, Inc.
Following Six Years of Decreases, the Average Approved Bureau Rate/Loss Cost Changes Have Been Increases for the Last Three YearsHistory of Average WC Bureau Rate/Loss Cost Level Changes Cumulative 1990-1993 +36.2% Cumulative 2000-2003 +17.0% Cumulative 1994-1999 -27.7% p Preliminary (states approved to date in 2004). Countrywide approved changes in advisory rates, loss costs and assigned risk rates as filed by the applicable rating organization. The countrywide change is a weighted average of individual state changes based on state premium volumes and ignoring effective dates. © 2004 National Council on Compensation Insurance, Inc.
Impact of Discounting on WC PremiumNCCI States—Private Carriers Based on data through 12/31/02 for the states where NCCI provides ratemaking services. Dividend ratios are based on calendar year statistics. © 2004 National Council on Compensation Insurance, Inc.
What are Some Key Components and Factors for WC Premiums? Loss Cost = f (customer, company, and/or industry losses, inflation, interest rate, medical technology, economy, etc.) + Risk Charge + Expenses + Tax Premium
The Rate of Change in Workers Compensation Indemnity Claim Costs Has Accelerated Since 1995 Annual Change 1991–1995: +0.3% Annual Change 1996–2002:+7.5% Based on data through 12/31/02, developed to ultimate. Based on the states where NCCI provides ratemaking services. Excludes the effects of deductible policies. © 2004 National Council on Compensation Insurance, Inc.
WC Indemnity Severity Is Outpacing Wage Inflation Source for Indemnity Severity: NCCI, based on data through 12/31/02. Based on the states where NCCI provides ratemaking services, excludes the effects of deductible policies. Source for CPS (Current Population Survey): Economy.com as of Feb 2004 © 2004 National Council on Compensation Insurance, Inc.
Workers Compensation Medical Claim Cost Trends Continue to Accelerate Annual Change 1991–1995:+4.0% Annual Change 1996–2002:+9.0% Based on data through 12/31/02, developed to ultimate. Based on the states where NCCI provides ratemaking services. Excludes the effects of deductible policies. © 2004 National Council on Compensation Insurance, Inc.
WC Medical Severity Has Also Been Growing Faster than the Medical CPI Source for Medical Severity: NCCI, based on data through 12/31/02, developed to ultimate. Based on the states where NCCI provides ratemaking services, excludes the effects of deductible policies. Source for Medical CPI: Economy.com as of Feb 2004 © 2004 National Council on Compensation Insurance, Inc.
WC Medical Losses Eclipsed Half of Total WC LossesNCCI States—Private Carriers 2002 Medical: 50.3% Indemnity: 49.7% 1991 Medical: 44.7% Indemnity: 55.3% Based on data through 12/31/02, developed to ultimate. Based on the states where NCCI provides ratemaking services. Excludes the effects of deductible policies. © 2004 National Council on Compensation Insurance, Inc.
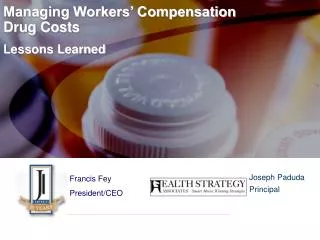
NCCI Prescription Drug Study • In 2001, workers compensation insurers paid roughly 75% more than group health for the same drugs • Prescription drug share of medical costs in workers compensation grew from 7% in Accident Year 1997 to approximately 10% in Accident Year 2001 • Utilization has a greater impact than price on workers compensation drug costs • Savings opportunities from using generic equivalents are present for less than 10% of total drug costs • Painkillers represent 55% of workers compensation drug costs © 2004 National Council on Compensation Insurance, Inc.
The Impact of Inflation is More Sensitive on Excess Policies
With Medical Technology, How Big Can a WC Claim Become? • Consider a 25-year old quadriplegic • Indemnity benefits of $23,500 a year • 24-hour attendant care costs of $135,000 a year • Other medical costs of $72,500 a year • These costs continue until death $ amounts are in millions. Attendant care assumed to increase at 3% per year
The Frequency of Lost-Time Claims Has Continued to Fall Through 2002 Workers Compensation Cumulative Change of –39.7% (1990-2002) Based on data through 12/31/02, developed to ultimate. Based on the states where NCCI provides ratemaking services. Excludes the effects of deductible policies. © 2004 National Council on Compensation Insurance, Inc.
Workers Compensation Frequency Trends Workers Compensation Frequency is Composed of Two Key Components: • Long-term improving trend due to working conditions • Short-term cyclical behavior that correlates with the economy © 2004 National Council on Compensation Insurance, Inc.
Rate of Work-Related Injuries Decreases Over Time Due to Improved Working Conditions Source: Bureau of Labor Statistics and Federal Reserve Bank of Dallas © 2004 National Council on Compensation Insurance, Inc.
Workplace Injury Incidence Rates— Decreases During Recessions and Increases in RecoveryCountrywide—Six Recessions Since 1960 Source: Bureau of Labor Statistics and National Bureau of Economic Research © 2004 National Council on Compensation Insurance, Inc.
Frequency by Loss RangeWithout Inflation Adjustment(Lost Time Claims) Percent Change Between Policies Expiring in 1997 and 2001 Source: NCCI * Actual policy expiration between 9/30/1996 and 8/31/1997 ** Actual policy expiration between 9/30/2000 and 8/31/2001 © 2004 National Council on Compensation Insurance, Inc.
Frequency by Loss RangeWith Inflation Adjustment(Lost Time Claims) Percent Change Between Policies Expiring in 1997 and 2001 Source: NCCI * Actual policy expiration between 9/30/1996 and 8/31/1997 ** Actual policy expiration between 9/30/2000 and 8/31/2001 Loss ranges have been adjusted for indemnity (4%) and medical (3%) inflation. © 2004 National Council on Compensation Insurance, Inc.
The Annual Change in Lost-Time Claim Costs per Worker Continued to Increase in 2002 Workers Compensation Based on data through 12/31/02, developed to ultimate. Based on the states where NCCI provides ratemaking services. Excludes the effects of deductible policies. © 2004 National Council on Compensation Insurance, Inc.
What Are Today’s Key Issues in Workers Compensation? • WC Medical Inflation • Growth in Residual Markets • Expiration of Terrorism Risk Insurance Act (TRIA) 12/31/2005 • Insurer and Reinsurer Downgrades, Insolvencies, and Consolidations • Legislative Issues
$1.1B $1. 4B $626M WC Residual Market Premium Increasedas of September 30, 2003 * Excludes Maine Residual Market Pool. ** Incomplete PY Projected to Ultimate © 2004 National Council on Compensation Insurance, Inc.
WC Residual Market Combined Ratiosas of September 30, 2003 * Excludes Maine Residual Market Pool. ** Incomplete PY Projected to Ultimate © 2004 National Council on Compensation Insurance, Inc.
WC Residual Market Underwriting Results Show Slight Deterioration as of September 30, 2003 * Excludes Maine Residual Market Pool. ** Incomplete PY Projected to Ultimate © 2004 National Council on Compensation Insurance, Inc.
Unique Challenges of Workers Compensation and Terrorism Coverage • Coverage mandated by law, exclusions are not possible • Benefits are defined by law, limits aren’t possible • Risks that aren’t written voluntarily will be backed by the entire market through the involuntary pool • Terrorism Risk Insurance Act (TRIA) expires 12/31/2005 • Government backstop goes away, unless Congress renews • Any policy effective after 1/1/2005 has exposure • NCCI developing filing strategy
Impacts of Insolvencies and Market Concentration • Market Concentration-has accelerated since 1992 • Only three of the top 10 groups of 20 years ago remain in the top 10 today • Insolvencies continue to be an issue • Impact remaining insurers • Create cash flow problems for states due to caps on annual recoupment from insurers • Impact allocation of Pool results to carriers – resulted in redistributions of over $84M to the residual market pool members in 2003 • Create data problems for advisory organizations
Most active session since the mid-1990s Over 1000 bills introduced, more than 150 enacted Many proposals for benefit increases, but few enacted State budget issues abound Many new governors, legislators and regulators Legislative UpdateIssues and Trends2003 Session Overview
Medical cost controls Expanded presumption of compensability for safety workers and emergency responders Clarification of coverage for adverse reactions to smallpox vaccine Medical Privacy Indemnity benefit increases Attorney fees Legislative UpdateIssues and Trends2003 Key Themes
Legislative Update2003 Key Enacted Legislation • California • Significant reforms signed into law 9/30/03 aimed at controlling medical costs. Included fee schedule changes, medical utilization controls, and repeal of voc rehab. WCRIB estimated impact on 2004 Pure Premium Rate Level -13.3% to -15.7% • Florida • SB 50A: numerous benefit changes resulting in –14.0% impact effective 10/01/03 • Medical fee schedule changes went into effect 01/01/04 • Maryland • Attorney fees, hospital fees, MD Supreme Court decision (Harris) with combined impact of +6.0%
Legislative Update2003 Key Enacted Legislation (cont’d) • Montana • Indemnity benefits, Montana court case (Stavenjord) with combined impact of +6.2% effective 7/1/03 • Nevada • Adoption of the 5th edition of the AMA Guides, introduction of COLA for PT claims, combined impact of +3.4% • New Mexico • Indemnity benefits, attorney fees and medical fee schedule changes with combined impact of +6.1% effective 7/1/03 • Oregon • Complete overhaul of PPD system to become effective in 2005
Legislative UpdateIssues and Trends2004 Emerging Themes • Employer vs Employee Choice of Physician • Erosion of Exclusive Remedy • Medical Fee Schedules • Attorney Fees • Indemnity Benefit Increases • Second Injury Funds • Containing Medical Costs