Download
1 / 13
130 likes | 418 Vues
Equilibria of Weak Acids & Bases Part VI: Polyprotic Acids & Titration Curves. Chap. 17 Sec 6. Dr. C. Yau Spring 2014. 1. Ionization of Polyprotic Acids. Carbonic acid is an example of a polyprotic acid (more specifically, a diprotic acid). What is the formula of carbonic acid?

E N D
Equilibria ofWeak Acids & BasesPart VI: Polyprotic Acids & Titration Curves Chap. 17 Sec 6 Dr. C. Yau Spring 2014 1
Ionization of Polyprotic Acids Carbonic acid is an example of a polyprotic acid (more specifically, a diprotic acid). What is the formula of carbonic acid? Write the ionization equations of carbonic acid. H2CO3 + H2O H3O+ + HCO3 HCO3 + H2O H3O+ + CO32 Note that pH is based on H3O+ and there are 2 sources! However, Kal > Ka2 so [H3O+] from 1st ioniz >> [H3O+] from 2nd ioniz If Kal >> Ka2 then this becomes negligible. Ka1 = 4.5x10⁻⁷ Ka2 = 4.7 x 10⁻¹¹ Compare Ka1 & Ka2 2
Note HCO3 isproduced in one step and consumed in the 2nd step. H2CO3 + H2O H3O+ + HCO3 HCO3 + H2O H3O+ + CO32 Ka1=4.5×10⁻⁷; Ka2=4.7×10⁻¹¹ Example 17.9 p. 807 Give the concentration of all species in 0.040 M H2CO3 as well as the pH. Do Pract Exer 40, 41 p. 808
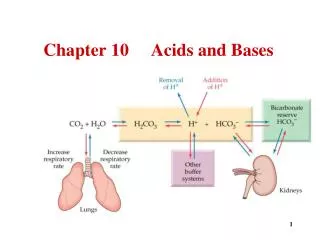
Salts Of Polyprotic Acids… are amphoteric, and most are basic in water. To predict the behavior in water, compare Ka to its Kb. Ex. Is an aqueous solution of NaHCO3 likely to be basic or acidic? NaHCO3 is a salt of neutral Na+ and amphoteric HCO3-. Ka=4.7×10⁻¹¹; Kb=1.0x10⁻¹⁴/4.5×10-11=2.22 ×10-4. Since Kb> Ka, the salt is basic in water.
Titration of Nitric Acid by NaOH 11 9 7 pH 5 3 1 0 10 20 30 Volume NaOH (mL) strong acid by strong base Equivalence Point What species are present at the 10-20 mL range? Why is the pH increasing?What species are present at 25 mL? at 30 mL?
Titration of Acetic Acid by NaOH 12 11 10 9 8 pH 7 6 5 4 3 0 10 20 30 Volume NaOH (mL) Equivalence Pt pH = 4.74 Significance of this pH? 13 mL 26 mL How is this graph different from the previous one? Why is it starting at pH 3? Why is pH increasing faster at 10-20mL Why is the equivalent point not at pH = 7? What is the significance of pH at 13 mL?
Titration of weak vs. strong acid by strong base Strong acid by strong base: equivalence pt is at pH = 7 Weak acid by strong base: equivalence pt is at pH > 7 (end with basic solution) Weak acid produces strong conjugate base, which increases the pH.
12 10 8 pH 6 4 Volume NaOH (mL) 2 0 5 10 15 20 25 30 (e) How is this graph different from the others? Why? If the acid is phosphoric acid, what species are present at (a), (b), (c), (d), (e)? (d) (c) (b) (a)
How is this graph different? Why is the equivalence point at pH lower than 7?
Reactions Of Acids And Bases Produce conjugate acid and bases May not create neutral products: strong acids + strong bases → neutral salts weak acids + strong bases→ basic salts strong acids + weak bases → acid salts weak acids + weak bases → amphoteric salts check Ka vs. Kb for dominance (we will not do titration calculations based on this type of reaction)
Color Indicators Indicators change color within specific pH ranges because each indicator is a weak organic acid H In + H2O H3O+ + In- As the concentrations of conjugate base vary, the color varies We usually choose an indicator whose pKa=pH at the endpoint of the reaction Select an indicator whose color change is light to dark at this pH to optimize visual detection
Acid-Base Indicators pH 3.2 to 4.4 methyl orange pH 4.8 to 6.4 methyl purple pH 6.0 to 7.6 bromothymol blue pH 8.2 to 10.0 phenolphthalein