Exploring Sampling and Inferences in Data Analysis
80 likes | 94 Vues
Investigate the randomness and representativeness of samples in data analysis and make inferences about populations. Analyze American robin weights and volleyball player preferences. Interpret dot plots and box-and-whisker plots.

Exploring Sampling and Inferences in Data Analysis
E N D
Presentation Transcript
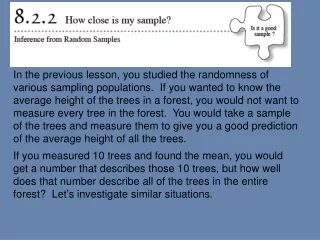
In the previous lesson, you studied the randomness of various sampling populations. If you wanted to know the average height of the trees in a forest, you would not want to measure every tree in the forest. You would take a sample of the trees and measure them to give you a good prediction of the average height of all the trees. If you measured 10 trees and found the mean, you would get a number that describes those 10 trees, but how well does that number describe all of the trees in the entire forest? Let’s investigate similar situations.
8-41. The sighting of American robins in yards is considered a sign that spring has arrived. You would like to know the average weight of an American robin in your town. Of course you cannot weigh every robin in town, even if you could figure out how to catch them all. A sample seems like a good idea. Think about how you can take a random sample from the population of robins in the envelope provided by your teacher. What things would be important to do? Discuss this with your team. Now take a random sample of ten robins from your envelope and record their weights. Each member of your team should do the same thing with their own random sample.
8-41. The sighting of American robins in yards is considered a sign that spring has arrived. You would like to know the average weight of an American robin in your town. Of course you cannot weigh every robin in town, even if you could figure out how to catch them all. A sample seems like a good idea. Calculate the mean of your sample. Do you think that your mean is representative of the population? What inferences can you make about the population from your sample? Compare your estimate of the population mean to the means of the other students in your team. Is your mean the true average weight for all American robins in town? Are any of your teammates’ numbers the true average? How can you explain any differences between the means?
8-42. Your estimate of the mean will probably be a little larger or smaller than the true average weight of robins. Let’s explore how much larger or smaller your estimate might be than the true average. • Follow your teacher’s directions to add your estimate of the population mean to the list with the rest of the class' estimates. Then, make a combination histogram and box plot of the data. Use a bin width of 5g on your histogram. • What causes variation in the sample means? That is, why are some of the sample means on your class graph so much larger or smaller than others? Why are so many of the sample means bunched up in the middle? • Within what interval do you suppose is the true mean weight of American robins?
8-43. Cyrus plays volleyball in county-wide tournaments. He wondered what portion of volleyball players prefer plain water over sports drinks during intense games. • At his next tournament, Cyrus selected 50 random players from all the teams to ask about their preference. 78% preferred plain water. What inference can Cyrus make about all the volleyball players in the county? • What additional information would Cyrus gain if it was practical to take many samples at many tournaments in the county?
8-43. Cyrus plays volleyball in county-wide tournaments. He wondered what portion of volleyball players prefer plain water over sports drinks during intense games. • If many samples could be taken, the distribution of percentages in each of the samples might look like this:% preferring water: • 84% 71% 73% 83% 80% 80% 79% 77% 81% 72% 81% 78% • Make a box plot of the sample means. With this additional information, make a new statement about volleyball players and water.
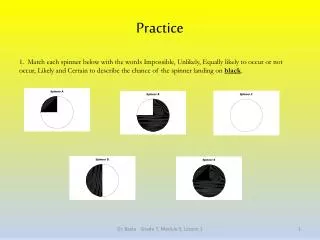
Practice 1. Here are two dot plots. Students were surveyed and asked what they thought their grade would be on a math exam. The results of the survey are in green. Then the students took the math test and the scores were plotted on the top graph in purple. The blue line is the halfway point between the scores. List 4 inferences you can make based upon the dot plots.
Practice 2. The figures to the right show the female life expectancies for countries of Africa and Europe. List 4 inferences you can make based upon the box-and-whiskers plot. List 2 DIFFERENT inferences you can make based upon the dot plot.