Download
1 / 1
130 likes | 451 Vues
Increasing Frequency. 50,000 cm -1. 12,820 cm -1. 4,000 cm -1. 400 cm -1. X-Ray. UV. Vis. NIR. MIR. FIR, Microwave. 200 nm. 380 nm. 780 nm. 2,500 nm. 25,000 nm. Increasing Wavelength. Figure 1: The electromagnetic spectrum.

E N D
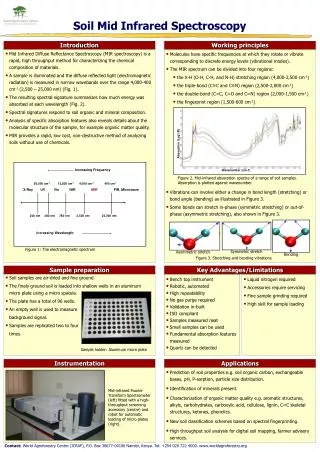
Increasing Frequency 50,000 cm-1 12,820 cm-1 4,000 cm-1 400 cm-1 X-Ray UV Vis NIR MIR FIR, Microwave 200 nm 380 nm 780 nm 2,500 nm 25,000 nm Increasing Wavelength Figure 1: The electromagnetic spectrum • Figure 2. Mid-infrared absorption spectra of a range of soil samples. Absorption is plotted against wavenumber. Absorption (Log1/R) Wavenumber (cm-1) Figure 3. Stretching and bending vibrations Symmetric stretch Asymmetric stretch Bending Soil Mid Infrared Spectroscopy Introduction Working principles • Mid Infrared Diffuse Reflectance Spectroscopy (MIR spectroscopy) is a rapid, high throughput method for characterizing the chemical composition of materials. • A sample is illuminated and the diffuse reflected light (electromagnetic radiation) is measured in narrow wavebands over the range 4,000-400 cm-1 (2,500 – 25,000 nm) (Fig. 1). • The resulting spectral signature summarizes how much energy was absorbed at each wavelength (Fig. 2). • Spectral signatures respond to soil organic and mineral composition. • Analysis of specific absorption features also reveals details about the molecular structure of the sample, for example organic matter quality. • MIR provides a rapid, low cost, non-destructive method of analyzing soils without use of chemicals. • Molecules have specific frequencies at which they rotate or vibrate corresponding to discrete energy levels (vibrational modes). • The MIR spectrum can be divided into four regions: • the X-H (O-H, C-H, and N-H) stretching region (4,000-2,500 cm-1) • the triple-bond (C≡C and C≡N) region (2,500-2,000 cm-1) • the double-bond (C=C, C=O and C=N) region (2,000-1,500 cm-1) • the fingerprint region (1,500-600 cm-1) • Vibrations can involve either a change in bond length (stretching) or bond angle (bending) as illustrated in Figure 3. • Some bonds can stretch in-phase (symmetric stretching) or out-of-phase (asymmetric stretching), also shown in Figure 3. Sample preparation Key Advantages/Limitations • Soil samples are air-dried and fine ground. • The finely ground soil is loaded into shallow wells in an aluminum micro plate using a micro spatula. • The plate has a total of 96 wells. • An empty well is used to measure • background signal. • Samples are replicated two to four • times. • Bench top instrument • Robotic, automated • High repeatability • No gas purge required • Validation in-built • ISO compliant • Samples measured neat • Small samples can be used • Fundamental absorption features measured • Quartz can be detected • Liquid nitrogen required • Accessories require servicing • Fine sample grinding required • High skill for sample loading Sample holder: Aluminum micro plate Instrumentation Applications • Prediction of soil properties e.g. soil organic carbon, exchangeable bases, pH, P-sorption, particle size distribution. • Identification of minerals present. • Characterization of organic matter quality e.g. aromatic structures, alkyls, carbohydrates, carboxylic acid, cellulose, lignin, C=C skeletal structures, ketones, phenolics. • New soil classification schemes based on spectral fingerprinting. • High throughput soil analysis for digital soil mapping, farmer advisory services. Mid-infrared Fourier Transform Spectrometer (left) fitted with a high-throughput screening accessory (centre) and robot for automatic loading of micro plates (right). Contact: World Agroforestry Centre (ICRAF), P.O. Box 30677-00100 Nairobi, Kenya. Tel: +254 020 722 4000. www.worldagroforestry.org


