Download
1 / 21
210 likes | 338 Vues
The CTAP I-93 program analyses population and employment growth in 29 communities influenced by I-93, projecting an additional 40,626 residents and 21,527 jobs. It highlights the impact on land use, forecasting the conversion of over 20,000 acres, especially in smaller towns. The program emphasizes strategic planning principles, advocating for concentrated development, preservation of natural areas, and sustainable practices to enhance community design, environmental health, and social capital amidst ongoing growth challenges.

E N D
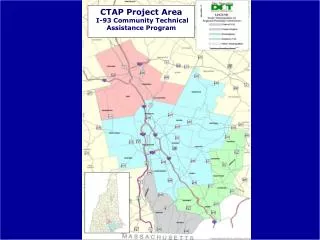
CTAP Project Area I-93 Community Technical Assistance Program
Overview • Growth context • Growth consequences • How should we grow? • The premise and promise of CTAP
I-93 Secondary Impacts Study Population • 40,626 additional population in 29 communities (35,314 in 23 NH communities) • 5% additional population overall • 7% in NH • 12% in smaller Towns (< 10,000 population) 26% 84%
I-93 Secondary Impacts Study Employment • 21,527 additional jobs in 29 communities (15,952 in 23 NH communities) • 5.5% additional growth overall • 6.8% in NH • 13% in smaller Towns (< 10,000 population) 17% 83%
I-93 Secondary Impacts Study Land Conversion • 20,223 additional acres in 29 communities (18,089 in 23 NH communities) • Larger increases in conversion in smaller towns (larger lot sizes) 27% 73%
Growth Segment – Background vs. Secondary Secondary Growth: 39,231 Base Growth: 112,567 Projected Population in 2020: 557,687
Population Trends Census (1970-2000: 1.9%/yr.) OEP Projections (2000-2025: 1.1%/yr.) I-93 Induced Growth (2000-2020: 1.6%/yr.)
Ex-Urban Population Growth - CTAP Communities 1940 2020 7X growth (168,112) 2X growth (96,303) Population: 141,474 Population: 405,889
Land Consumption • Change in developed land, 1962 – 1998: • From 36,519 acres (7.9%) to 98,417 acres (21.2%) • Increase of 61,898 acres, or 13.3% of the county • Average of 1750 acres of conversion per year. • Average land ‘consumption’ per unit of development increasing Source: Forty Years of Land Use Change in Rockingham and Strafford Counties, Complex System Research Center and CICEET)
Developed Road Frontage Miles of developed road frontage: Source: Forty Years of Land Use Change in Rockingham and Strafford Counties, Complex System Research Center and CICEET)
Impervious Surface Total impervious area values above approximately 5% are associated with impaired water quality Source: Forty Years of Land Use Change in Rockingham and Strafford Counties, Complex System Research Center and CICEET)
Implications of Existing Growth Pattern • Land consumption • Environment: air and water quality • Travel demand & congestion • Road infrastructure and maintenance • Energy consumption • Community design, character, ‘social capital’ • Public health & wellness
Some Key Planning Principles for the Future • Concentrate development to conserve land, and to maximize use/efficiency of infrastructure • Prevent or limit development in areas with high conservation value, and link those areas in regional networks • Move toward multi-density zoning model (rural towns), (Villages & town, mixed use centers/Conservation Zones/Density transfers) • Build on brownfields, not greenfields • Utilize minimum impact development techniques and green building design • Preserve historic buildings and other cultural and community assets • Balance job growth with housing supply • Encourage development that can be efficiently served by pedestrian, bicycle and transit