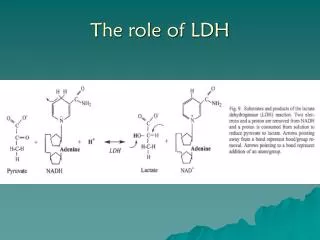
Analysis of LDH Activity Across Multiple Days Using ANOVA
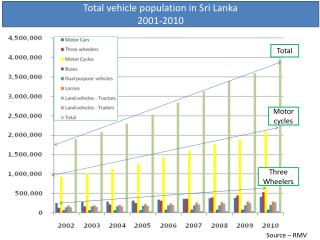
This study examines the activity of lactate dehydrogenase (LDH) isoenzymes over a series of experimental days, employing ANOVA statistical analysis with significant results at p < 0.001. Data is presented for total LDH activity as well as specific isoenzyme activities (LDH1, LDH2, LDH3, LDH4, and LDH5) measured in mIU/mg protein. The analysis spans various time points, including days -2, 7, 13, 21, 33, 50, and 80, highlighting significant changes in enzyme activity levels. Such insights could enhance our understanding of metabolic changes under different conditions.
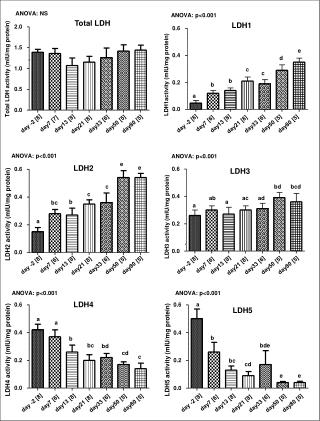

Analysis of LDH Activity Across Multiple Days Using ANOVA
E N D
Presentation Transcript
ANOVA: NS ANOVA: p<0.001 Total LDH LDH1 2.0 0.6 1.5 e 0.4 d Total LDH activity (mIU/mg protein) c 1.0 c LDH1activity (mIU/mg protein) b 0.2 b 0.5 a day21 [8] day21 [8] day21 [8] day21 [8] day21 [8] day21 [8] day -2 [8] day -2 [8] day -2 [8] day -2 [8] day -2 [8] day -2 [8] day7 [6] day7 [7] day7 [6] day7 [6] day7 [6] day7 [6] day13 [8] day13 [8] day13 [8] day13 [8] day13 [8] day13 [8] day33 [6] day33 [6] day33 [6] day33 [6] day33 [6] day50 [5] day33 [6] day50 [5] day50 [5] day50 [5] day50 [5] day50 [5] day80 [5] day80 [5] day80 [5] day80 [5] day80 [5] day80 [5] 0.0 0.0 ANOVA: p<0.001 ANOVA: p<0.001 e e LDH2 0.6 0.6 LDH3 c bd bcd c ab ac ad 0.4 0.4 b a bc a LDH2 activity (mIU/mg protein) LDH3 activity (mIU/mg protein) a 0.2 0.2 0.0 0.0 ANOVA: p<0.001 ANOVA: p<0.001 a LDH4 0.6 0.6 LDH5 a a 0.4 0.4 b b bc bde bd LDH5 activity (mIU/mg protein) LDH4 activity (mIU/mg protein) cd c bc 0.2 0.2 cd e e 0.0 0.0