Download
1 / 73
730 likes | 900 Vues
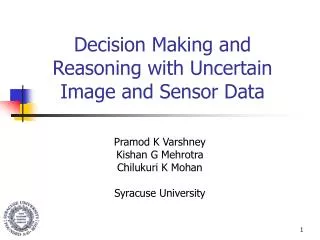
Decision Making and Reasoning with Uncertain Image and Sensor Data. Pramod K Varshney Kishan G Mehrotra Chilukuri K Mohan Syracuse University. Outline. Introduction Main overall themes Results since last review Scenario Recognition: Audio Visual Sensor Fusion

E N D
Decision Making and Reasoning with Uncertain Image and Sensor Data Pramod K Varshney Kishan G Mehrotra Chilukuri K Mohan Syracuse University
Outline • Introduction • Main overall themes • Results since last review • Scenario Recognition: Audio Visual Sensor Fusion • Path Planning for dynamic military applications • Concluding remarks
Information Acquisition andFusion Model for Visualization • Dynamic network connectivity with varying bandwidths • Mobile agents with heterogeneous resources and capabilities
Our Main Overall Themes • Decentralized inferencing • Data/information fusion • Uncertainty representation and visualization • Planning and decision making in dynamic battlefield environments.
Outline • Introduction • Main overall themes • Results since last review • Scenario Recognition: Audio Visual Sensor Fusion • Path Planning for dynamic military applications • Concluding remarks
Objectives • Develop a proof of concept of a system, which • Classifies Activity based on • Video based detection and tracking of moving objects • Detects and classifies situational sounds • Fuses information from two different modalities to provide enhanced scene context • Handles issues such as uncertainty in sensor data and coupling between events in different streams
System Block Diagram Scene Descriptor Video Processing Video Fusion Framework Audio Processing Audio
Video Processing Pipeline Image Acquisition Background Subtraction Detection Feature Extraction Activity Classification
Video Processing Pipeline • Video Features • aspect ratio • speed • relative densities of pixels in upper middle and lower bands • Activity classes include walking, sitting, bending, etc • Classifier is a multi-module back-propagation neural network
Example: Multi Object Tracking Multi-Object Tracking in Infra Red Modality
Example : Tracking with ID Tags • Unique ID assigned to each tracked object. • Tracking using object properties and last known location.
Head Tracking for Improved Performance • Head is tracked separately • Maintain tracking of individuals in groups • Locate head in top 1/6 of the object.
Audio Processing Pipeline Audio Acquisition Histogram Features LPC / Cepstral Coefficients Spectral Features Relative Band Energies Choice of Features Audio Event Classification
Audio Processing Pipeline • Sound Classes • Silence/Background Hum • Machine noise • Alarm sounds • Human Speech • Features used for sound classification • Amplitude Histogram Features • Spectral Centroid and Zero Crossing Rate • Spectrum shape modeling coefficients • Relative Band energies • Linear Predictive Coding Coefficients • Cepstral Coefficients
Audio Video Fusion • Having defined the processing pipeline for the two modalities, we • develop a framework for information fusion from sensors • apply to the surveillance domain • recognize different scenarios.
Fusion Approach Two steps: • Decisions regarding certain activities or events are made in each information stream, based on low level data processing. • Fusion of these stream-level decisions takes place, involving three main challenges: • Asynchronism • Linkage • Uncertainty
Asynchronism • Events in different streams are processed asynchronously– e.g., Video events are detected on a per frame basis; and Audio events are detected over a period of time. • This asynchronism makes it challenging to fuse information from different modalities
Linkage • The information sensed in different streams may not be independent; it may describe the same event. • Framework for fusion must accommodate causal coupling between events across streams.
Modeling Linkages Correlation analysis on the training data is used to extract linkage information between features of different sensor streams.
Fusion Model Video / IR sensor Sound Sensor k Inference : Theft in Progress!! Inference: running
Stream Model • At fixed intervals δi , decisions oi regarding the presence of events are made for the mth stream by classifiers. We use trained multi-module feed-forward neural networks to make these decisions. • At time instants k, a decision O* is calculated using the decisions (oi’s) available in that time interval for a given stream: a fuzzy rule-based approach facilitates computation of O*).
Fusion Framework • Fusion rules are generated using the Linkage Information learnt from the training data. • When events with stronger linkages are detected, we write the sub-scenario being corroborated by both events, whereas weakly linked events are written as separate events ex : running and alarm sound (0.1)-> possible suspicious activity bending and human speech (0.01)->2 uncorrelated events
Fusion Framework (continued) • Certainty values for sub-scenario observations are modified incrementally based on Linkage information. • A time series of sub-scenarios is generated, giving a complete scenario description over a period of time.
Illustrative Example 1 • Parking lot setting.
Video Sensor Input Raw video of a staged robbery Processed video of the robbery
Illustrative Example 2 Conversation
Visualizing other Information • Some scene variables can be visualized in sensor space • Decision Uncertainty • Threat levels • Classes of Moving Objects • Classes of Activity
Uncertainty Visualization • Modulate bounding box brightness to indicate object class Brightness of bounding box indicates certainty Color of bounding box indicates whether single person or group
Uncertainty Visualization • Bar Indicators to indicate object class Height of Bar indicator proportional to certainty Color of the bar indicates whether single person or a group
Summary • Demonstrated a framework for fusion of audio and video information. • Fusion of information from sensors of different modalities provides a richer scene context . • Use of probabilistic models for fusion and feature level fusion being considered. • We have shown the feasibility of activity recognition using combined video and audio information. • Next section (path planning): after activity recognition, battlefield decision-maker must act.
Outline • Introduction • Main overall themes • Results since last review • Scenario Recognition: Audio Visual Sensor Fusion • Path Planning for dynamic military applications • Concluding remarks
Path Planning in a Battlefield • To determine safe paths for personnel in a battlefield • The battlefield is represented as a graph where nodes correspond to different geographical locations with risk values • The quality of a path is measured by cumulative risk associated with the path
Problem Formulation • Path P : A non cyclic sequence (L1,L2….Ln) where L1 is the initial location of personnel, Ln is a target or exit point, and each Liis adjacent to Li+1 in the graph. • Determine safe paths which maximize path quality Q(P) defined as k Q(P)= log(1-risk(Li)) i=1
Modeling Risks • We define risk as the probability of occurrence of a high level of damage to personnel traversing a path • Risk values at different locations can be modeled by probability distributions.
Optimal path computation for situational visualization (in collaboration with Bill Ribarsky) Green route: the optimal path Red semitransparent circle: the range of risks
Problem Formulation • To compute near-optimal paths from a source to a destination with minimum computational effort. • The battlefield is modeled via a graph where the nodes represent different geographical locations • Quality measure: The cumulative risk associated with the path
Why Hierarchical Path Planning? • Non-hierarchical approaches such as Dijkstra’s algorithm are computationally very expensive for graphs with large number of nodes. • Hierarchical approaches • Solve the path planning problem in a hierarchcial graph with smaller number of nodes • Minimize the computational effort which is critical in real time applications such as battlefield path planning
Our Approach • Partition the original graph into different subgraphs and compute representative risks for each subgraph • Higher level path: compute a path in the hierarchical graph where each node represents a subgraph • Lower level path: Compute actual paths within each subgraph. The final path is a concatenation of the lower level paths in different subgraphs
Illustration of a Path Computed by HIPLA: Edge connecting boundary nodes Boundary node Source, destination nodes Sub path
Dynamic Scenario • Risk values associated with different locations change with time • Example: A segment of the path may become more risky due to the occurrence of a new event such as an explosion • Problem: compute a new path from the current location of the personnel to the destination node.
Our Solution for the Dynamic Path Planning Problem • Re-estimate the representative risk values only for subgraphs whose risk values have changed • Refine the current path by recomputing a new path from the current node to the destination bypassing the subgraphs whose risk values have increased.
An Illustration of the Dynamic Scenario Current location New path Current path Source, destination nodes
Simulation Results • We compared HIPLA with two other well known path planning algorithms viz., hierarchical shortest paths algorithm (SPAH)[Jung et al., IEEE trans. KDE, 2002]and Dijkstra’s algorithm with pruning (DP)[Wagner et al., Journal of Experimental algorithmics, 2005] • HIPLA obtains near-optimal solutions (worst case quality penalty within 5%) with much less computational effort compared to DP and SPAH
Quality Degradation of HIPLA Compared to the Optimal Solution * USA road map available at: http://www.cs.princeton.edu/courses/spring05/cos226/assignments/map/