Multinomial Logistic Regression: Detecting Outliers and Validating Analysis
930 likes | 1.36k Vues
Learn how to identify outliers in multinomial logistic regression analysis using SPSS. Compare model accuracies with and without outliers. Follow step-by-step instructions to validate your analysis.

Multinomial Logistic Regression: Detecting Outliers and Validating Analysis
E N D
Presentation Transcript
Multinomial Logistic Regression:Detecting Outliers and Validating Analysis Outliers Split-sample Validation
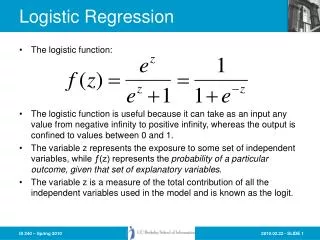
Outliers • Multinomial logistic regression in SPSS does not compute any diagnostic statistics. • In the absence of diagnostic statistics, SPSS recommends using the Logistic Regression procedure to calculate and examine diagnostic measures. • A multinomial logistic regression for three groups compares group 1 to group 3 and group 2 to group 3. To test for outliers, we will run two binary logistic regressions, using case selection to compare group 1 to group 3 and group 2 to group 3. • From both of these analyses we will identify a list of cases with studentized residuals greater than ± 2.0, and test the multinomial solution without these cases. If the accuracy rate of this model is less than 2% more accurate, we will interpret the model that includes all cases.
Example To demonstrate the process for detecting outliers, we will examine the relationship between the independent variables "age" [age],"highest year of school completed" [educ] and "confidence in banks and financial institutions" [confinan] and the dependent variable "opinion about spending on social security" [natsoc]. Opinion about spending on social security contains three categories: 1 too little 2 about right 3 too much With all cases, including those that might be identified as outliers, the accuracy rate was 63.7%. We note this to compare with the classification accuracy after removing outliers to determine which model we will interpret.
Request multinomial logistic regression for baseline model Select the Regression | Multinomial Logistic… command from the Analyze menu.
Selecting the dependent variable Second, click on the right arrow button to move the dependent variable to the Dependent text box. First, highlight the dependent variable natsoc in the list of variables.
Selecting metric independent variables Metric independent variables are specified as covariates in multinomial logistic regression. Metric variables can be either interval or, by convention, ordinal. Move the metric independent variables, age, educ and confinan to the Covariate(s) list box.
Specifying statistics to include in the output While we will accept most of the SPSS defaults for the analysis, we need to specifically request the classification table. Click on the Statistics… button to make a request.
Requesting the classification table Third, click on the Continue button to complete the request. First, keep the SPSS defaults for Model and Parameters. Second, mark the checkbox for the Classification table.
Completing the multinomial logistic regression request Click on the OK button to request the output for the multinomial logistic regression. The multinomial logistic procedure supports additional commands to specify the model computed for the relationships (we will use the default main effects model), additional specifications for computing the regression, and saving classification results. We will not make use of these options.
Classification accuracy for all cases With all cases, including those that might be identified as outliers, the accuracy rate was 63.7%. We will compare the classification accuracy of the model with all cases to the classification accuracy of the model excluding outliers.
Outliers for the comparison of groups 1 and 3 Since multinomial logistic regression does not identify outliers, we will use binary logistic regressions to identify them. Choose the Select Cases… command from the Data menu to include only groups 1 and 3 in the analysis.
Selecting groups 1 and 3 First, mark the If condition is satisfied option button. Second, click on the IF… button to specify the condition.
Formula for selecting groups 1 and 3 To include only groups 1 and 3 in the analysis, we enter the formula to include cases that had a value of 1 for natsoc or a value of 3 for natsoc. After completing the formula, click on the Continue button to close the dialog box.
Completing the selection of groups 1 and 3 To activate the selection, click on the OK button.
Binary logistic regression comparing groups 1 and 3 Select the Regression | Binary Logistic… command from the Analyze menu.
Dependent and independent variables for the comparison of groups 1 and 3 First, move the dependent variable natsoc to the Dependent variable text box. Second, move the independent variables age, educ, and confinan to the Covariates list box. Third, click on the Save… button to request the inclusion of standardized residuals in the data set.
Including studentized residuals in the comparison of groups 1 and 3 First, mark the checkbox for Studentized residuals in the Residuals panel. Second, click on the Continue button to complete the specifications.
Outliers for the comparison of groups 1 and 3 Click on the OK button to request the output for the logistic regression.
Locating the case ids for outliers for groups 1 and 3 In order to exclude outliers from the multinomial logistic regression, we must identify their case ids. Choose the Select Cases… command from the Data menu to identify cases that are outliers.
Replace the selection criteria To replace the formula that selected cases in group 1 and 3 for the dependent variable, click on the IF… button.
Formula for identifying outliers Type in the formula for including outliers. Note that we are including outliers because we want to identify them. This is different that previous procedures where we included cases that were not outliers in the analysis. Click on the Continue button to close the dialog box.
Completing the selection of outliers To activate the selection, click on the OK button.
Locating the outliers in the data editor We used Select cases to specify a criteria for including cases that were outliers. Select cases will assign a 1 (true) to the filter_$ variable if a cases satisfies the criteria. To locate the cases that have a filter_$ value of 1, we can sort the data set in descending order of the values for the filter variable. Click on the column header for filter_$ and select SortDescending from the drop down menu.
The outliers in the data editor At the top of the sorted column for filter_$, we see four 1’s indicating that 4 cases met the criteria for being considered an outlier.
Outliers for the comparison of groups 2 and 3 The process for identifying outliers is repeated for the other comparison done by the multinomial logistic regression, group 2 versus group 3. Since multinomial logistic regression does not identify outliers, we will use binary logistic regressions to identify them. Choose the Select Cases… command from the Data menu to include only groups 2 and 3 in the analysis.
Selecting groups 2 and 3 First, mark the If condition is satisfied option button. Second, click on the IF… button to change the condition.
Formula for selecting groups 2 and 3 To include only groups 2 and 3 in the analysis, we enter the formula to include cases that had a value of 2 for natsoc or a value of 3 for natsoc. After completing the formula, click on the Continue button to close the dialog box.
Completing the selection of groups 2 and 3 To activate the selection, click on the OK button.
Binary logistic regression comparing groups 2 and 3 Select the Regression | Binary Logistic… command from the Analyze menu.
Outliers for the comparison of groups 2 and 3 The specifications for the analysis are the same as the ones we used for detecting outliers for groups 1 and 3. Click on the OK button to request the output for the logistic regression.
Locating the case ids for outliers for groups 2 and 3 In order to exclude outliers from the multinomial logistic regression, we must identify their case ids. Choose the Select Cases… command from the Data menu to identify cases that are outliers.
Replace the selection criteria To replace the formula that selected cases in group 2 and 3 for the dependent variable, click on the IF… button.
Formula for identifying outliers Type in the formula for including outliers. Note that we use the second version of the standardized residual, sre_2. Click on the Continue button to close the dialog box.
Completing the selection of outliers To activate the selection, click on the OK button.
Locating the outliers in the data editor We used Select cases to specify a criteria for including cases that were outliers. Select cases will assign a 1 (true) to the filter_$ variable if a cases satisfies the criteria. To locate the cases that have a filter_$ value of 1, we can sort the data set in descending order of the values for the filter variable. Click on the column header for filter_$ and select SortDescending from the drop down menu.
The outliers in the data editor At the top of the sorted column for filter_$, we see that we have two outliers. These two outliers were among outliers for the analysis of groups 1 and 3.
The caseid of the outliers Since the studentized residuals were only calculated for a subset of the cases, the cases not included were assigned missing values and would be excluded from the analysis if the selection criteria were based on standardized residuals. We will use caseid in the selection criteria instead. The case id for the outlier is “20002045”, “20002413”, “20000012”, and “20000816." These are the cases that we will omit from the multinomial logistic regression.
Excluding the outliers from the multinomial logistic regression To exclude the outlier from the analysis, we will use the Select Cases… command again.
Changing the condition for the selection Click on the IF… button to change the condition.
Excluding cases identified as outliers To include all of the cases except the outlier, we set caseid not equal to the subject's id. Note that the subject's id is put in quotation marks because it is string data in this data set. After completing the formula, click on the Continue button to close the dialog box.
Completing the exclusion of the outlier To activate the exclusion, click on the OK button.
Multinomial logistic regressionexcluding the outlier Select the Regression | Multinomial Logistic… command from the Analyze menu.
Running the multinomial logistic regression without the outlier The specifications for the analysis are the same as the ones we used the multinomial logistic regression with all cases. Click on the OK button to request the output for the logistic regression.
Classification accuracy after omitting outliers With all cases the classification accuracy rate for the multinomial logistic regression model was 63.7%. After omitting the outlier, the accuracy rate improved to 65.3%. Since the amount of the increase in accuracy was less than 2%, the multinomial logistic regression model with all cases will be interpreted.
75/25% Cross-validation Strategy • In this validation strategy, the cases are randomly divided into two subsets: a training sample containing 75% of the cases and a holdout sample containing the remaining 25% of the cases. • The training sample is used to derive the multinomial logistic regression model. The holdout sample is classified using the coefficients for the training model. The classification accuracy for the holdout sample is used to estimate how well the model based on the training sample will perform for the population represented by the data set. • While it is expected that the classification accuracy for the validation sample will be lower than the classification for the training sample, the difference (shrinkage) should be no larger than 2%. • In addition to satisfying the classification accuracy, we will require that the significance of the overall relationship and the relationships with individual predictors for the training sample match the significance results for the model using the full data set.
75/25% Cross-validation Strategy • SPSS does not classify cases that are not included in the training sample, so we will have to manually compute the classifications for the holdout sample if we want to use this strategy. • We will run the analysis for the training sample, use the coefficients from the training sample analysis to compute classification scores (log of the odds) for each group, compute the probabilities that correspond to each group defined by the dependent variable, and classify the case in the group with the highest probability.
Restoring the outlier to the data set To include the outlier back into the analysis, we will use the Select Cases… command again.
Restoring the outliers to the data set Mark the All cases option button to include the outlier back into the data set. To activate the exclusion, click on the OK button.
Re-running the multinomial logistic regression with all cases Select the Regression | Multinomial Logistic… command from the Analyze menu.
Requesting the multinomial logistic regression again The specifications for the analysis are the same as the ones we have been using all along. Click on the OK button to request the output for the multinomial logistic regression.