Download
1 / 10
100 likes | 132 Vues
This project studies pH, iron, and sulfate in water affected by acid mine drainage in a Pennsylvania watershed. Students create databases, maps, and reports analyzing geospatial data for problem-solving.

E N D
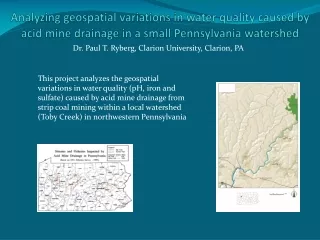
Analyzing geospatial variations in water quality caused by acid mine drainage in a small Pennsylvania watershed This project analyzes the geospatial variations in water quality (pH, iron and sulfate) caused by acid mine drainage from strip coal mining within a local watershed (Toby Creek) in northwestern Pennsylvania Dr. Paul T. Ryberg, Clarion University, Clarion, PA
Applied GIS course Taught by Geography faculty member in our department Geology faculty as advisors for student geoscience projects Students taking the Applied GIS course must have first successfully completed the basic GIS undergraduate course. They must have the skills to construct and query databases, and work with a variety of spatial data and imagery
Hydrogeology Project for an Undergraduate Applied GIS Course This project is used instead of a final exam in an upper level undergraduate course in Applied GIS. A student may propose their own project, or choose one from a list from the instructor. A brief proposal must be approved by the instructor before the project can begin. Over several weeks, students will have regular meetings with the instructor to verify progress and sort out any difficulties. Students will construct a working, query-able database, use appropriate imagery, and use it to analyze a problem, understand cause and effect, and show changes with time. A final report must be submitted with all supporting documentation in digital form. Students also give a PP presentation in one of the last class meetings
Concept Goals Students should be able to define the scope and extent of a specific project Students should be able to construct a working, query-able database appropriate to the project Students should be able to produce a clear, detailed written summary of the project Students should be able to construct clear, detailed cross-sections and maps appropriate to the project Students should be able to present a clear and logical summary of the project to others
Higher Order Thinking Goals Students should be able to analyze the relationships of the geospatial data to recognize changes in time and space Students should be able to develop strategies for problem solving (i.e. remediation) Students should be able to use geospatial data to make future predictions in time and space
Database In order to observe the effects of AMD on Toby Creek’s watershed, data was collected at multiple points along Toby Creek and its tributaries. The collection was done by a professor and students from Clarion University during the summers of 2000 through 2009. Water samples were analyzed for the following parameters: Temperature, Conductivity, Eh, pH, total Iron and Sulfate concentration. The samples were collected at the same designated locations each year, which allows analysis of change in water quality over time and place. Tables were created in Microsoft Excel to organize the data that was then incorporated into a database in ArcCatalog 9.3
Methods A database was created in ArcCatalog that holds layers and feature classes of multiple types of data. The coordinate system that was used in this project was the North American Datum of 1983 UTM Zone 17N. The county boundaries of Pennsylvania were obtained from the Pennsylvania Spatial Data Access (PASDA) website and were used for a map projection to locate Toby Creek watershed. A feature class was created to contain the vector data of point layers and stream layers. The outline polygon of the drainage basin was from Clarion University’s M drive data sets and layers. Raster datasets of different stream buffers were created using different tools in ArcMap 9.3. The streams that were within the drainage basin boundaries were extracted using the Extract analysis tool. Spatial Analyst Tools such as the IDW interpolation were used as ways to interpolate the stream data into a specific number of classes. Multiple methods were attempted to find an accurate and correct way to display and interpret the data. The IDW (Inverse Distance Weighted) interpolation method estimates the raster cell values based on the water quality data by averaging the values of data within a neighborhood of cell values.
pH variations in stream tributaries Models were developed to classify overall stream quality to prioritize the remediation of the basin tributaries IDW interpolation Method of the stream’s pH values for monitoring water quality represented in 3 classes (left) and 32 classes (right)
Total dissolved iron variation Total Iron concentrations are interpreted in three classes. Concentrations of less than or equal to 9 ppm of Fe are considered low, between 10 and 25 ppm are moderate, and greater than 25 ppm are considered high
Land use classification Variations in stream chemistry are closely related to land uses (clearly visible on various RS imagery) which have changed locally over time An unsupervised land cover classification map was created using ERDAS as a way to show the strip mined areas in relation to the stream and the collection sites