Download
1 / 26
260 likes | 285 Vues
This presentation delves into the strengths and limitations of market intelligence data in pharmaceutical policy analysis for LMIC. It covers the collection, sources, and quality of volume and medical data, sampling and projection techniques, and data quality processes. The focus is on understanding what data is gathered, why it is collected in certain ways, and where it is sourced from for comprehensive policy analysis.

E N D
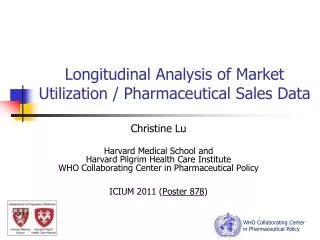
Strengths and Limitations of Market Intelligence Data for Pharmaceutical Policy Analysis in LMIC ICIUM 2011 - Third International Conference for Improving Use of Medicines Antalya, November 2011
Agenda • Introduction to: • Volume data • Medical Data • Sampling and projection • Data quality process • Summary What do we collect, why do we collect it in that way & where we collect it
Volume data: Collected from different parts of the supply chain, depending on the country
20% 72% 71% 18% 70% 1% 7% 6% 3% 5% 1% 2% 1% ThailandChannels ofdistribution Updated 2010 Agents/distributors Manufacturers Own distributor Wholesalers Healthcenters & private clinics Retail drugstores type A & B Non drugstoreoutlets General hospitals Special hospitals Consumers Market covered by TLPI Market covered by TLHI Status 2009 Results are based on information provided by 27 manufacturersthat represent 30% of the market share.
Ecuador – multi-source sampling • Data sources: • MF data (unprojected) • Distributor data (unprojectable) • Wholesaler data (projectable) • Chain pharmacies (unprojectable) • Independent pharmacies (projectable)
Data points Information typically captured (volume data) Derived characteristics (EPhMRA ATC, Manufacturer, Corporation, Molecule, Salt, Launch, Brand/Unbranded, Volume (Units, SU or Kg)
Information captured in medical data No in-patient Diagnosis Patient demographics • ICD10 codes • Doctorwording • Co-diagnoses • Treated/untreated • Age • Sex • Smoker/non-smoker • Insurance Doctordemographics Therapy • Age, sex • Speciality • Year qualified • University • Region • Productprescribed • Desiredeffect • Co-prescription • ATC, NDF • Dosagedata
Sampling and projectionKey elements of sampling concepts The right balance determines the relevance of our measurements
Sampling and projectionSample design stratification Weighting variables + Geospatial
Data quality – sampling error components Random Error:Unviewed ≠ sample • Sample size • Stratification • Selection Systematic Error =data collection • Non-response • Incompletereporting • Reporting time • Reporting quality
Data quality: Sample design Brazil
IMS Annual Validation Studies (for sales data) • Since 1964, in collaboration with industry associations (EPhMRA, BPIRG), we conduct annual comparisons with our customers, contrasting IMS data estimates with actual industry sales. • These ‘validation studies’ are carried out in more than 60 markets with ~ 2,200 pharmaceutical companies, covering more than 70,000 product forms. • The results are published once a year in the IMS Annual Report on Quality Assurance – ACTS. • All validation studies follow the same uniform procedure and reporting is standardized in order to allow cross-country comparisons and easy reading.
Bias (only for sales data) Average over/underestimation of the real market performance: Total IMS units of all validated product forms Total real units of all validated product forms Example: Pack IMS Units Real Units R-Value A 1,000 900 1.111 B 1,200 1,500 0.800 Bias = -3.4% C 4,000 3,800 1.053 D 6,500 7,000 0.929 E 7,200 7,400 0.973 Total 19,900 20,600 0.966
Precision Index (only for sales data)Example of Precision R-Value Distribution R-Value Class No. of R-Values from to 0.475 0.575 15 0.575 0.675 35 0.675 0.775 55 0.775 0.875 230 0.875 0.975 590 0.975 1.075 770 1.075 1.175 410 1.175 1.275 100 Σ = 2,070 2,070 2,280 R-Values inside ±22.5% deviation range R-Values in total 1.275 1.375 45 1.375 1.475 25 1.475 1.525 5 Total 2,280
Share of total volume used in validation comparison (2009) Latvia = 27% Malaysia = 29% Mexico = 36% Turkey = 66% Venezuela = 72%
Limitations of data utilization • Prices • Collected only at one point in supply chain • Generally list prices • Discounting not always known or able to be taken into account • Coverage • Not all channels, and samples of channels • Often combines public and private in same audit • Accuracy varies by product size for sample-based data • Almost all audits are sample based • Inpatient prescribing not available • Cross country comparisons using medical data needs to bear in mind specialty mix
Reimbursement policy assessment and impact • Generic market evolution • Generics policies and impact • Pricing policy impact on volume • Potential savings (using country own price data) • Medicines shortages • Quality of care initiatives assessment and impact • Unwarranted variations in volumes • Pharmaceutical “gaps” • Usage by indication • Exposure studies • Adherence to guidelines • WHO/National Essential Drug List • Therapy area formularies e.g. antibiotics
IMS Institute for Healthcare InformaticsGlobal Health Research ProgramMurray Aitken, Executive Director, IMS Institute for Healthcare Informatics
IMS Institute for Healthcare InformaticsGlobal Health Research Program • Objective • Elements of the program • Access to IMS Health data and support • Training and education • Coordination and alignment of activities • Terms and conditions of support • Program operation • External Advisory Council • Research agenda priorities • Research proposal criteria