Download
1 / 22
250 likes | 631 Vues
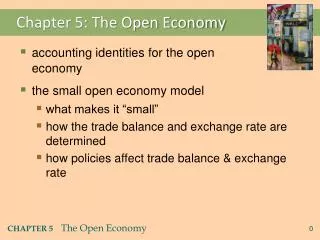
Chapter 5: The Open Economy. accounting identities for the open economy the small open economy model what makes it “small” how the trade balance and exchange rate are determined how policies affect trade balance & exchange rate. Imports and exports (% of GDP), 2008. In an open economy,.

E N D
Chapter 5: The Open Economy • accounting identities for the open economy • the small open economy model • what makes it “small” • how the trade balance and exchange rate are determined • how policies affect trade balance & exchange rate
In an open economy, • spending need not equal output • saving need not equal investment
Preliminaries superscripts: d = spending on domestic goods f = spending on foreign goods EX = exports = foreign spending on domestic goods IM = imports = Cf+ If+ Gf= spending on foreign goods NX = net exports (a.k.a. the “trade balance”) = EX – IM
Y = C + I + G + NX net exports domestic spending output The national income identity in an open economy or, NX= Y– (C+ I + G)
Trade surpluses and deficits • trade surplus:output > spending and exports > imports Size of the trade surplus = NX • trade deficit:spending > output and imports > exports Size of the trade deficit = –NX NX = EX – IM = Y– (C+ I + G )
International capital flows • Net capital outflow = S – I = net outflow of “loanable funds” = net purchases of foreign assets the country’s purchases of foreign assets minus foreign purchases of domestic assets • When S > I, country is a net lender • When S < I, country is a net borrower
The link between trade & cap. flows NX= Y– (C+ I+ G ) implies NX = (Y– C– G ) – I = S – I trade balance = net capital outflow Thus, a country with a trade deficit (NX < 0) is a net borrower (S <I ).
Saving, investment, and the trade balance (percent of GDP) 1960-2010 investment saving trade balance (right scale)
U.S.: “The world’s largest debtor nation” • Every year since 1980s: huge trade deficits and net capital inflows, i.e. net borrowing from abroad • As of 12/31/2009: • U.S. residents owned $18.4 trillion worth of foreign assets • Foreigners owned $21.1 trillion worth of U.S. assets • U.S. net indebtedness to rest of the world:$2.7 trillion--higher than any other country, hence U.S. is the “world’s largest debtor nation”
An open-economy version of the loanable funds model from Chapter 3. Includes many of the same elements: production function consumption function investment function exogenous policy variables Saving and investment in a small open economy
r S, I National saving: The supply of loanable funds As in Chapter 3,national saving does not depend on the interest rate
Assumptions about capital flows a. domestic & foreign bonds are perfect substitutes (same risk, maturity, etc.) b. perfect capital mobility:no restrictions on international trade in assets c. economy is small:cannot affect the world interest rate, denoted r* a & b imply r = r* c implies r*is exogenous
r I(r) S, I Investment: The demand for loanable funds Investment is still a downward-sloping function of the interest rate, but the exogenous world interest rate… r* …determines the country’s level of investment. I(r*)
r rc I(r) S, I If the economy were closed… …the interest rate would adjust to equate investment and saving:
r r* rc I(r) S, I I1 But in a small open economy… the exogenous world interest rate determines investment… NX …and the difference between saving and investment determines net capital outflow and net exports
Next, three experiments: 1.Fiscal policy at home 2.Fiscal policy abroad 3.An increase in investment demand(exercise)
r NX2 NX1 Results: I(r) S, I I1 1. Fiscal policy at home An increase in G or decrease in T reduces saving.
Budget deficit (left scale) Net exports (right scale) NX and the federal budget deficit (% of GDP), 1965-2009 8% 2% 6% 4% 0% 2% - 2% 0% - 4% - 2% - 4% - 6% 1965 1970 1975 1980 1985 1990 1995 2000 2005 2010
r NX2 NX1 I(r) S, I 2. Fiscal policy abroad Expansionary fiscal policy abroad raises the world interest rate. Results:
r S NX1 I(r)1 S, I I1 NOW YOU TRY:3. Increase in Investment Demand Use the model to determine the impact of an increase in investment demand on NX, S, I, and net capital outflow.