Download
1 / 34
340 likes | 365 Vues
Explore US healthcare and pharmaceutical trends, factors influencing expenditures, future cost containment tactics, and recent growth deceleration explanations.

E N D
Lee Vermeulen, R.Ph., M.S., FCCP Director, Center for Drug Policy University of Wisconsin Hospital and Clinics Clinical Associate Professor UW – Madison School of Pharmacy LC.Vermeulen@hosp.wisc.edu Forecasting and ManagingMedication Expenditures – 2009 Update
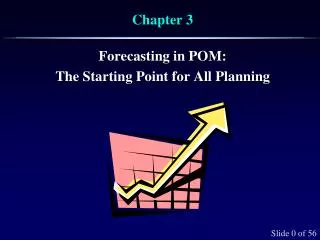
Overview • Discuss trends in US health care and pharmaceutical expenditures • Outline drivers of pharmaceutical expenditures and discuss the 2009 forecast of pharmaceutical expenditures • Discuss financial management tactics to respond to future cost containment pressure
Total US Health Care Expenditures Table adapted from Hartman et al. Health Affairs 2009;28:246-261. Data from CMS.
Pharmaceutical Expenditures and Growth Figure from Aitken et al. Health Affairs 2009;28:w151-160w. Data from IMS. Table adapted from Hartman et al. Health Affairs 2009;28:246-261. Data from CMS.
Growth in Pharmaceutical Expenditures by Channel Hoffman JM, Shah ND, Vermeulen LC, et al. Forecasting future drug expenditures 2009. Am J Health-Syst Pharm. 2009;66:237-257. Data from IMS.
Top 10 Drug Classes in Hospitals Hoffman JM, Shah ND, Vermeulen LC, et al. Forecasting future drug expenditures 2009. Am J Health-Syst Pharm. 2009;66:237-257. Data from IMS.
Top 15 Drugs in Hospitals Hoffman JM, Shah ND, Vermeulen LC, et al. Forecasting future drug expenditures 2009. Am J Health-Syst Pharm. 2009;66:237-257. Data from IMS.
Top 15 Drugs in Clinics Hoffman JM, Shah ND, Vermeulen LC, et al. Forecasting future drug expenditures 2009. Am J Health-Syst Pharm. 2009;66:237-257. Data from IMS.
Factors Driving Pharmaceutical Expenditure Growth • Price • Utilization • Per capita utilization of prescription drugs • “Mix” and new technology • Some innovative products used to treat previously untreated disease; true innovation • Many marginally improved, “me too” products that gain preference over older agents for various (sometimes irrational) reasons • Increasing intensity of drug therapy; add-on therapies vs replacements (triple drug tx vs single drug tx)
Explanations for Recent Deceleration in Growth(1) • Increase in generic drug availability and utilization • Shift in co-pay differentials; gap widening • 2000: $7 generics, $13 preferred, $17 non-preferred • 2005: $10 generics, $22 preferred, $35 non-preferred • 2008: $6 generics, $29 preferred, $40 non-preferred Figure from Aitken et al. Health Affairs 2009;28:w151-160w. Data from IMS. Kaiser/HRET Survey of Employer-Sponsored Health Benefits: 2000-2005.
Explanations for Recent Deceleration in Growth(2) • Diminished innovation • Reduction in number of blockbuster drug products approved by FDA • Recently, lower spend on individual blockbusters Figure from Aitken et al. Health Affairs 2009;28:w151-160w. Data from IMS.
Explanations for Recent Deceleration in Growth(3) • Ongoing impact of prescription to OTC status • Non-sedating antihistamines • Proton pump inhibitors • Consumer safety concerns • Increase in number and significance of new “black box” warnings • Meta analyses demonstrating safety concerns (e.g., rosiglitazone) • Continued increase in number of market withdrawals
Explanations for Recent Deceleration in Growth(4) • Lower growth of Medicare Part D • Decrease in growth after huge jump in initial spending • More aggressive contracting and better performance of plans • Improved performance of Medicaid prescription drug programs • Following big drop with implementation of Medicare Part D, continued decline • Improved formulary management (Medicaid programs finally catching up with commercial insurer strategies!) • Impact of overall economic downturn on commercial side • Increase in unemployment • For those employed, decrease in generosity of insurance (higher out-of-pocket expenses) • Decrease in clinic visits
Summary of Factors Potentially AffectingFuture Growth • Continued growth of generic products with substantial products coming (see 2009 forecast for details) • Ongoing slowing of innovation with fewer market entries as weak economy has reduced R&D investments (see 2009 forecast for details) • Continued impact of economic downturn on employment, etc. (potentially affected by HC reform or incremental changes in publicly funded programs) • Continued impact of demographic changes
Projection of US Health Care and Pharmaceutical Expenditures Source: Data from CMS. National Health Expenditure Projections 2007-2017. Available at http://www.cms.hhs.gov/NationalHealthExpendData/Downloads/proj2007.pdf. Accessed July 1, 2009. See also Keehan et al, Health Affairs 2008;27: w145–w155.
2009 Forecast of Pharmaceutical Expenditures by Channel • Use with caution… not a “multiplier” • Clinics include prescriber offices and hospital outpatient clinics where meds are administered Hoffman JM, Shah ND, Vermeulen LC, et al. Forecasting future drug expenditures 2009. Am J Health-Syst Pharm. 2009;66:237-257. Data from IMS.
Not out of the woods yet… • Many factors may act to increase future expenditures and require vigilance • Isolated areas of substantial expenditure growth • New, very expensive biologics; small numbers of patients, huge cost • Orphan drugs • Antimicrobials • Continued impact of medication shortages • H1N1 novel influenza • Potential impact of FDA reform • Response to decreases in medication use leading to poorer outcomes and resulting increases in total cost of care
Response to Trends:Tactical Approach to Financial Management for Pharmacy Leaders
Improved Financial Planning (1) • Systematic, step-wise approach to budgeting for medications, identifying cost containment targets and conducting financial management • Resources • Annual forecast of expenditures and trends in AJHP • Summary of budgeting process in AJHP, January 15, 2005 • Andy Wilson’s new book “Financial Management for Health-System Pharmacists” (2009, ASHP)
Improved Financial Planning(2) • Key messages • Data, data, data • Focus your attention on key drivers of cost; 60-80 products account for 80-90% of hospital drug budget • Consider diffusion patterns of newer products • Creative cost containment tactics • Moderation of trend vs actual reduction in expenditure • Monitor performance monthly; trend analysis, variance reporting • Financial performance metrics • Cost per day vs cost per discharge • Watch volume of cost-driving service elements • Use benchmarks with caution (“compass vs thermometer”)
Evidence-based “Tool Kit” (1) Variety of tools used to ensure the safe, rational, efficient and ethical use of health care interventions in the treatment of patients Some passive tools that do not involve direct interventions on prescribing Some active tools involve direct intervention on prescribing 21
Passive tools Prescriber education and cost awareness campaigns Clinical practice guidelines Medication use evaluation, report cards Active tools Medication formulary and restrictions Prior authorization Generic and therapeutic interchange Protocol-based independent pharmacist prescribing IV to PO Renal dose adjustment Collaborative practice agreements Antimicrobial stewardship program Evidence-based “Tool Kit” (2) 22
Impact of clinical pharmacists accepting responsibility for both clinical and financial implications of medication use 1988 to 1995, n = 104 studies Schumock GT, Meek PD, Ploetz PA, Vermeulen LC. Pharmacotherapy 1996;16:1188-1208. 1996 to 2000, n = 59 studies Schumock GT, Butler MG, Meek PD, Vermeulen LC, et al. Pharmacotherapy 2003;23:113-132. 2001 to 2005, n = 93 Perez A, Doloresco F, Hoffman JM, Meek PD, Touchette DR, Vermeulen LC, Schumock GT, American College of Clinical Pharmacy. Economic evaluations of clinical pharmacy services: 2001-2005. Pharmacotherapy. 2009;29:128. (See http://www.accp.com/ for full report.) Value of Clinical Pharmacy Services 23
Clinical Pharmacy Services R.O.I.“Highest R.O.I. in Healthcare” 24
Antimicrobial Stewardship Program (1) Huge portion of inpatient budget in antibiotics, antifungals Commitment of resources to stewardship program Separate subcommittee of P&T Pharmacist and Infectious Disease faculty member employed by pharmacy Daily activities Data resource for infection control 25
Goal: Maximize appropriate utilization of antimicrobial and antifungal therapies to control both resistance and expense Antimicrobial portion of inpatient drug budget: 22.9% (FY05), 20.5% (FY08) Cost-avoidance in 2009 Budget = $600,000 Team consists of a clinical pharmacist, an ID physician, infection control and microbiology Methods Development of evidence-based guidelines Cereplex software to identify targeted interventions Daily interdisciplinary rounds Restriction of specific antibiotics and antifungals to ID approval Antimicrobial Stewardship Program (2) 12.9% 26
“Internal” Prior Authorization of Clinic Administered Injectables (1) Policy response #1, ban on “brown-bagging” of infused medications Exceptions on case-by-case basis, often economic issues (WRT patient out of pocket expense) Policy response #2, prior authorization program for all clinic administered injectable medications with cost of >$5,000 per year Currently infliximab, omalizumab, plerixafor, botox, palivizumab, natalizumab Future IVIG, albumin, rituximab 27
Key components of program Pharmacy department-based program Center for Drug Policy develops guidelines for use Subcommittee of P&T reviews and approves guidelines and oversees program Pharmacy staff reviews requests for medications Appeals process for denials Independent of insurance or ability to pay Inpatient application; essential for management of transition of care “Internal” Prior Authorization of Clinic Administered Injectables (2) 28
Cancer Chemotherapy Management (1) Risks and cost of cancer chemotherapy create substantial challenges Recent emergence of biologics (EGFR inhibitors, VEGF inhibitors, etc) raise stakes While national standards are prominent in cancer care (guidelines from ASCO, NCCN), variation in care common Questionable value from substantial investments (life expectancy gains of days, months for tens of thousands of dollars in added cost) Huge reimbursement challenges Increasing interest in cost-effectiveness by oncologists 29
Cancer Chemotherapy Management (2) Cost containment focusing on supportive care (n/v, pain, infection, anemia, neutropenia) common Efforts to limit chemotherapy decision making needed Chemotherapy Review Council developed to manage safety, reduce variability and open dialogue regarding cost 30
Cancer Chemotherapy Management (3) Individual groups of oncologists apply for “core” status of specific chemo regimens Specific disease, stage, etc. Specific routes, doses and dosing intervals Evidence (phase III trials; no abstracts) Cost and reimbursement analysis Far more restrictive than P&T Committee If approved by Chemo Council, can be ordered If not approved, must seek patient-specific approval before use (appeal process) 31
Cancer Chemotherapy Management (4) Results Decrease from approx. 500 combinations to under 300 “core” recipes In 2 years, fewer than 50 patient-specific requests with 30% denial rate More consistency in prescribing Status as sub-committee of P&T Expanding to supportive care review Critical venue for debate over “productive” vs “unproductive” treatment and cost/value issues 32
Summary Substantial deceleration in expenditure growth for pharmaceuticals in all channels Likely continued decline in rate of growth for short-term Many factors may put pharmaceutical expenditures in spotlight again Vigilance, improved financial management, creative cost-containment will remain critical for pharmacy leaders 33
Lee Vermeulen, R.Ph., M.S., FCCP Director, Center for Drug Policy University of Wisconsin Hospital and Clinics Clinical Associate Professor UW – Madison School of Pharmacy LC.Vermeulen@hosp.wisc.edu Questions?