Download
1 / 75
820 likes | 1.19k Vues
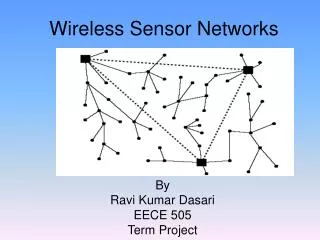
Chapter 3: Factors Influencing Sensor Network Design. Factors Influencing Sensor Network Design. A. Hardware Constraints B. Fault Tolerance (Reliability) C. Scalability D. Production Costs E. Sensor Network Topology F. Operating Environment (Applications) G. Transmission Media

E N D
Chapter 3: Factors Influencing Sensor Network Design
Factors Influencing Sensor Network Design A. Hardware Constraints B. Fault Tolerance (Reliability) C. Scalability D. Production Costs E. Sensor Network Topology F. Operating Environment (Applications) G. Transmission Media H. Power Consumption (Lifetime)
Location Finding System Mobilizer Transceiver Sensor ADC Processor Memory Antenna Power Unit Sensor Node Hardware SENSING UNIT PROCESSING UNIT
Fault Tolerance(Reliability) • Sensor nodes may fail due to lack of power, physical damage or environmental interference • The failure of sensor nodes should not affect the overall operation of the sensor network • This is called RELIABILITY or FAULT TOLERANCE, i.e., ability to sustain sensor network functionality without any interruption
Fault Tolerance (Reliability) • Reliability R (Fault Tolerance) of a sensor node k is modeled: • i.e., by Poisson distribution, to capture the probability of not having a failure within the time interval (0,t) with lk is the failure rate of the sensor node k and t is the time period. G. Hoblos, M. Staroswiecki, and A. Aitouche, “Optimal Design of Fault Tolerant Sensor Networks,” IEEE Int. Conf. on Control Applications, pp. 467-472, Sept. 2000.
Fault Tolerance (Reliability) • Reliability (Fault Tolerance) of a broadcast range with N sensor nodes is calculated from
Fault Tolerance (Reliability) EXAMPLE: • How many sensor nodes are needed within a broadcast radius (range) to have 99% fault tolerated network? • Assuming all sensors within the radio range have same reliability, previous equation becomes: • Drop t and substitute f = (1-R) 0.99 = (1 – fN) N=2
Fault Tolerance (Reliability) REMARK: 1. Protocols and algorithms may be designed to address the level of fault tolerance required by sensor networks. 2. If the environment has little interference, then the requirements can be more relaxed.
Fault Tolerance (Reliability) • Examples: • House to keep track of humidity and temperature levels the sensors cannot be damaged easily or interfered by environment low fault tolerance (reliability) requirement!!!! • Battlefield for surveillance the sensed data are critical and sensors can be destroyed by enemies high fault tolerance (reliability) requirement!!! Bottom line: Fault Tolerance (Reliability) depends heavily on applications!!!
Scalability • The number of sensor nodes may reach thousands in some applications • The density of sensor nodes can range from few to several hundreds in a region (cluster) which can be less than 10m in diameter
Scalability Node Density: The number of expected nodes per unit area: N is the number of scattered sensor nodes in region A Node Degree: The number of expected nodes in the transmission range of a node R is the radio transmission range Basically: m(R) is the number of sensor nodes within the transmission radius R of each sensor node in region A.
Scalability EXAMPLE: Assume sensor nodes are evenly distributed in the sensor field. Determine the node density and node degree if 200 sensor nodes are deployed in a 50x50 m2 region where each sensor node has a broadcast radius of 5m. Use the eq.
Scalability Examples: • Machine Diagnosis Application: less than 50 sensor nodes in a 5 m x 5 m region. • Vehicle Tracking Application:Around 10 sensor nodes per cluster/region. • Home Application: tens depending on the size of the house. • Habitat Monitoring Application:Range from 25 to 100 nodes/cluster • Personal Applications:Ranges from tens to hundreds, e.g., clothing, eye glasses, shoes, watch, jewelry.
Production Costs • Cost of sensors must be low so that sensor networks can be justified! • PicoNode: less than $1 • Bluetooth system: around $10,- • THE OBJECTIVE FOR SENSOR COSTS • must be lower than $1!!!!!!! • Currently ranges from $25 to $180 (STILL VERY EXPENSIVE!!!!)
Sensor Network Topology Sink Internet, Satellite, UAV Sink Task Manager
Sensor Network Topology • Topology maintenance and change: • Pre-deployment and Deployment Phase • Post Deployment Phase • Re-Deployment of Additional Nodes
Sensor Network TopologyPre-deployment and Deployment Phase • Dropped from aircraft (Random deployment) • Well Planned, Fixed (Regular deployment) • Mobile Sensor Nodes • Adaptive, dynamic • Can move to compensate for deployment shortcomings • Can be passively moved around by some external force (wind, water) • Can actively seek out “interesting” areas
Sensor Network TopologyInitial Deployment Schemes • Reduce installation cost • Eliminate the need for any pre-organization and pre-planning • Increase the flexibility of arrangement • Promote self-organization and fault-tolerance
Sensor Network TopologyPOST-DEPLOYMENT PHASE • Topology changes may occur: • Position • Reachability (due to jamming, noise, moving obstacles, etc.) • Available energy • Malfunctioning
Operating Environment * SEE ALL THE APPLICATIONS discussed before
TRANSMISSION MEDIA • Radio, Infrared, Optical, Acoustic, Magnetic Media • ISM (Industrial, Scientific and Medical) Bands (433 MHz ISM Band in Europe and 915 MHz as well as 2.4 GHz ISM Bands in North America) • REASONS: Free radio, huge spectrum allocation and global availability.
POWER CONSUMPTION • Sensor node has limited power source • Sensor node LIFETIME depends on BATTERY lifetime • Goal: Provide as much energy as possible at smallest cost/volume/weight/recharge • Recharging may or may not be an option • Options • Primary batteries – not rechargeable • Secondary batteries – rechargeable, only makes sense in combination with some form of energy harvesting
Battery Examples • Energy per volume (Joule per cubic centimeter):
Energy Scavenging (Harvesting)Ambient Energy Sources (their power density) • Solar (Outdoors) – 15 mW/cm2(direct sun) • Solar (Indoors) – 0.006 mW/cm2(office desk) 0.57 mW/cm2 (<60 W desk lamp) • Temperature Gradients – 80 W/cm2 at about 1V from a 5Kelvin temp. difference • Vibrations – 0.01 and 0.1 mW/cm3 • Acoustic Noises – 3*10{-6} mW/cm2 at 75dB - 9.6*10{-4} mW/cm2 at 100dB • Nuclear Reaction – 80 mW/cm3
POWER CONSUMPTION • Sensors can be a DATA ORIGINATOR or a DATA ROUTER. • Power conservation and power management are important • POWER AWARE COMMUNICATION PROTOCOLSmust be developed.
Power Consumption • Power consumption in a sensor network can be divided into three domains • Sensing • Data Processing (Computation) • Communication
Power Consumption • Power consumption in a sensor network can be divided into three domains • Sensing • Data Processing (Computation) • Communication
Power Consumption Sensing Depends on • Application • Nature of sensing: Sporadic or Constant • Detection complexity • Ambient noise levels Rule of thumb (ADC power consumption) Fs - sensing frequency, ENOB - effective number of bits
Power Consumption • Power consumption in a sensor network can be divided into three domains • Sensing • Data Processing (Computation) • Communication
The power consumption in data processing (Pp) is f clock frequency C is the aver. capacitance switched per cycle (C ~ 0.67nF); Vdd is the supply voltage VT is the thermal voltage (n~21.26; Io ~ 1.196 mA) Power Consumption in Data Processing (Computation)(Wang/Chandrakarasan: Energy Efficient DSPs for Wireless Sensor Networks. IEEE Signal Proc. Magazine, July 2002. also from Shih paper)
Power Consumption in Data Processing (Computation) • The second term indicates the power loss due to leakage currents • In general, leakage energy accounts for about 10% of the total energy dissipation • In low duty cycles, leakage energy can become large (up to 50%)
Power Consumption in Data Processing • This is much less than in communication. • EXAMPLE: (Assuming: Rayleigh Fading wireless channel; fourth power distance loss) • Energy cost of transmitting 1 KB over a distance of 100 m is approx. equal to executing 0.25 Million instructions by a 8 million instructions per second processor (MicaZ). • Local data processing is crucial in minimizing power consumption in a multi-hop network
Memory Power Consumption • Crucial part: FLASH memory • Power for RAM almost negligible • FLASH writing/erasing is expensive • Example: FLASH on Mica motes • Reading: ¼ 1.1 nAh per byte • Writing: ¼ 83.3 nAh per byte
Power Consumption • Power consumption in a sensor network can be divided into three domains • Sensing • Data Processing (Computation) • Communication
Power Consumption for Communication • A sensor spends maximum energy in data communication (both for transmission and reception). • NOTE: • For short range communication with low radiation power (~0 dbm), transmission and reception power costs are approximately the same, • e.g., modern low power short range transceivers consume between 15 and 300 mW of power when sending and receiving • Transceiver circuitry has both active and start-up power consumption
Power Consumption forCommunication • Power consumption for data communication(Pc) Pc = P0 + Ptx + Prx TX RX • Pte/re is the power consumed in the transmitter/receiver electronics (including the start-up power) • P0 is the output transmit power
Power Consumption for Communication • START-UP POWER/ START-UP TIME • A transceiver spends upon waking up from sleep mode, e.g., to ramp up phase locked loops or voltage controlled oscillators. • During start-up time, no transmission or reception of data is possible. • Sensors communicate in short data packets • Start-up power starts dominating as packet size is reduced • It is inefficient to turn the transceiver ON and OFF because a large amount of power is spent in turning the transceiver back ON each time.
Wasted Energy • Fixed cost of communication: Startup Time • High energy per bit for small packets (from Shih paper) • Parameters: R=1 Mbps; Tst ~ 450 msec, Pte~81mW; Pout = 0 dBm
Energy vs Packet Size Energy per Bit (pJ) As packet size is reduced the energy consumption is dominated by the startup time on the order of hundreds of microseconds during which large amounts of power is wasted. NOTE: During start-up time NO DATA CAN BE SENT or RECEIVED by the transceiver.
Start-Up and Switching • Startup energy consumption Est = PLO x tst • PLO, power consumption of the circuitry (synthesizer and VCO); tst, time required to start up all components • Energy is consumed when transceiver switches from transmit to receive mode • Switching energy consumption Esw = PLO x tsw
Start-Up Time and Sleep Mode • The effect of the transceiver startup time will greatly depend on the type of MAC protocol used. • To minimize power consumption, it is desirable to have the transceiver in a sleep mode as much as possible • Energy savings up to 99.99% (59.1mW 3mW) • BUT… • Constantly turning on and off the transceiver also consumes energy to bring it to readiness for transmission or reception.
Receiving and Transmitting Energy Consumption • Receiving energy consumption Erx = (PLO + PRX ) trx • PRX, power consumption of active components, e.g., decoder, trx, time it takes to receive a packet • Transmitting energy consumption Etx = (PLO + PPA ) ttx • PPA, power consumption of power amplifierPPA = 1/h Pout • h, power efficiency of power amplifier, Pout, desired RF output power level
RF output power • http://memsic.com/support/documentation/wireless-sensor-networks/category/7-datasheets.html?download=148%3Amicaz
Power Amplifier Power Consumption • Receiving energy consumption PPA = 1/h ∙ gPA ∙ r ∙ dn • gPA, amplifier constant (antenna gain, wavelength, thermal noise power spectral density, desired signal to noise ratio (SNR) at distance d), • r, data rate, • n, path loss exponent of the channel (n=2-4) • d, distance between nodes
Let’s put it together… • Energy consumption for communication Ec = Est + Erx + Esw + Etx = PLO tst + (PLO + PRX)trx + PLO tsw + (PLO+PPA)ttx • Let trx = ttx = lPKT/r Ec = PLO (tst+tsw)+(2PLO + PRX)lPKT/r + 1/h ∙ gPA ∙ lPKT∙ dn Distance-independent Distance-dependent
A SIMPLE ENERGY MODEL ETx (k,D) Etx (k,D) = Etx-elec (k) + Etx-amp (k,D) Etx (k,D) = Eelec * k + eamp * k * D2 ETx-amp (k,D) ETx-elec (k) ERx (k) = Erx-elec (k) ERx (k) = Eelec * k k bit packet Transmit Electronics Tx Amplifier D eamp* k* D2 Eelec * k ERx (k) k bit packet Receive Electronics Eelec * k
Power Consumption(A Simple Energy Model) Assuming a sensor node is only operating in transmit and receive modes with the following assumptions: • Energy to run circuitry: Eelec = 50 nJ/bit • Energy for radio transmission: eamp = 100 pJ/bit/m2 • Energy for sending k bits over distance D ETx (k,D) = Eelec * k + eamp * k * D2 • Energy for receiving k bits: ERx (k,D) = Eelec * k
Example using the Simple Energy Model What is the energy consumption if 1 Mbit of information is transferred from the source to the sink where the source and sink are separated by 100 meters and the broadcast radius of each node is 5 meters? Assume the neighbor nodes are overhearing each other’s broadcast.
EXAMPLE 100 meters / 5 meters = 20 pairs of transmitting and receiving nodes (one node transmits and one node receives) ETx (k,D) = Eelec * k + eamp * k * D2 ETx = 50 nJ/bit . 106 + 100 pJ/bit/m2 . 106 . 52 = = 0.05J + 0.0025 J = 0.0525 J ERx (k,D) = Eelec * k ERx = 0.05 J Epair = ETx + ERx = 0.1025J ET = 20 . Epair = 20. 0.1025J = 2.050 J