Advancing Supercomputer Performance Through Interconnection Topology Synthesis
220 likes | 269 Vues
Explore advanced methods for optimizing supercomputer performance through interconnection topology synthesis, featuring a design flow, algorithms, and efficient evaluation techniques. The research delves into interconnection networks and practical applications to enhance computational efficiency.

Advancing Supercomputer Performance Through Interconnection Topology Synthesis
E N D
Presentation Transcript
Advancing Supercomputer Performance Through Interconnection Topology Synthesis Yi Zhu, Michael Taylor, Scott B. Baden and Chung-Kuan Cheng Department of Computer Science and Engineering University of California, San Diego
Outline • Introduction • Design Flow, Formulation & Algorithms • Example: Blue Gene/L Packaging • Overview • Models & Constraints • Experiments • Benchmark Instances • Generated Instances • Conclusion & Future Work
Interconnection Networks • Interconnection networks become a more critical factor than computing or memory modules (W.Dally, HPCA 2007 Keynote Speech) • Popular network topologies: • Hypercube (SGI Origin2000) • 2D torus (Cray X1) • 3D torus (Cray T3E and XT3, IBM Blue Gene/L) • Crossbar (NEC Earth Simulator) • Folded Clos (Cray BlackWidow) • Fat tree, flattened butterfly, Etc.
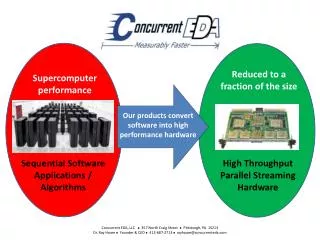
Our Work • We propose a design methodology to select the best topology to minimize the average latency • Design flow is fully automated • Physical constraints can be specified by users • Efficient multi-commodity flow algorithm to evaluate • Demonstrate the efficiency using Blue Gene/L packaging framework
Delay Models Topology Pool Best Topology MCF Evaluation Solver Communication Patterns Physical Constraints Design Flow
Multi-Commodity Flow (MCF) • Graph G(V,E) • K commodities, each has a source and a sink, and demand amount d(k) • Each edge e has a capacity u(e) • Each edge e has a weight w(e) • Minimum Cost MCF: each commodity k is routed units under the capacity constraints, minimize , where f(e) is the flow routed on edge e
Map Supercomputer Performance Evaluation to MCF Problem • Nodes –processors • Edges –interconnection links • Commodities –communications • Demands –communication bandwidth(injection rate) • Flow amount –wires assignments • Capacity constraints –physical constraints (wires, pins, board dim) • Edge weight –unit latency (unit power)
An Example on Maximum Concurrent Flow • Two commodities: s1->t1, s2->t2, both have demand d(1)=d(2)=1 • Optimal throughput = 1.5
Approximation Algorithms • The duality theory in LP: for a maximization, primal feasible , dual feasible D, optimal solution OPT • Increase and decrease D iteratively till the duality gap is small enough
Midplane: 8x8x8 Torus Blue Gene/L: An Example
Assumptions • We follow the same hierarchical structure: midplane – node card – compute card • The properties of boards (dimensions, # layers, dielectric) keep unchanged • We seek better topologies than the existing 3D torus to implement the networks in the midplane
Topology Generation • Generate 8-node 1D topologies and duplicate to each row and column • Topologies are isomorph-free and has maximum degree bound for each node #isomorph-free topologies
Node Card Graph Model Horizontal: Strongly Connected; Vertical: Generated Topology
Midplane Graph Model Coteus et al., “Packaging the Blue Gene/L Supercomputer”IBM J of Res & Dev, Vol. 43, pp. 213-248
Experiment 1: Benchmark Instances • NAS Parallel Benchmarks (121/128 processes) Benchmark source code Best topology Compiled with Intel Trace Collector & Analyzer Our design flow Executable Task placement Run on multi-processor machines Simulated annealing placement Traffic Patterns Output
Benchmarks Characteristics Communication Pattern: MG
Results • Optimal: each instance has different topology • Aggregate: one topology for all instances • 3D Torus: 3D torus topology
Experiment 2: Generated Instances • Randomly generated communications • Scalar values which represent the demand for bandwidth between each pair of nodes • More general, time independent • Control Parameters • # communication demands: O(n) pairs • Communication amount: uniform traffic but vary case by case (different congestion level)
Latency & Throughput Tradeoffs Distribution: 40% / 50% / 10%
Topologies with Different Injection Rates With larger injection rate, more (red) links are needed to go through the cut between 4 and 5, in order to reduce the number of hops
Conclusion • An design flow for interconnection network synthesis • Fully automated • Explore large design space • Efficient evaluation algorithm • Future work • Power consumption • Accurate simulation
Q&A Thank you!