Download
1 / 32
320 likes | 341 Vues
This study analyzes estimates of carbon (C) changes in US agricultural soils from 1982 to 1997 using two approaches: the IPCC method and the Century model. The study evaluates the projections of spatial distribution of soil C changes and compares the strengths and weaknesses of alternative approaches. It also discusses the impact of past and improved agricultural practices on soil C sequestration.

E N D
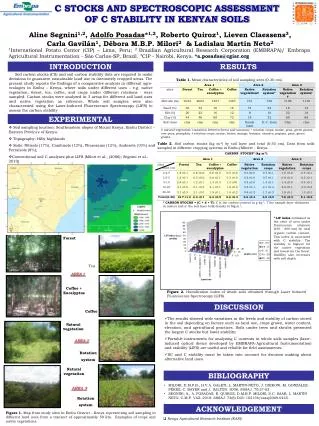
Estimates of C changes in US agricultural soils: IPCC and Century approaches Keith Paustian Mark Easter, Marlen Eve, Kendrick Killian, Steve Ogle, Mark Sperow, Steve Williams Colorado State University R. Follett USDA – Agricultural Research Service
Objectives • Background on national level C inventory/projection methods. • Discuss estimates of soil C changes in US agricultural soils for the period 1982-1997, as a function of management changes. • Evaluate projections of spatial distribution of soil C changes. • Comparison of alternative approaches: strengths and weaknesses • Issues regarding ecosystem-economic model interactions.
Past Agricultural Practices Erosion Intensive tillage Residue removal Low Productivity CO2 Soil organic matter
Improved Agricultural Practices Conservation tillage Cover crops Conservation buffers Improved rotations CO2 Soil organic matter
Reduced and zero tillage Set-asides/conversions to perennial grass Reduction/elimination of summer-fallow Winter cover crops More hay in crop rotations Higher residue (above- & below-ground) yielding crops Practices for C sequestration
Modified IPCC national inventory method Century model based approach National level soil C assessment
DATABASES Spatial Inventory/survey • USDA-NRCS Major Land Resource Areas • USDA-NRCS / OSU PRISM Climatic Data • USDA-NRCS STATSGO Soils Data • USDA-NRCS National Resources Inventory • Conservation Technology Information Center - Crop Residue Management Survey • USDA-ERS Cropping Practices Survey • USDA-NASS Agricultural Statistics • USDA-NRCS Pedon soils data Validation and Uncertainty Analysis • Long-term field experiment data • Comprehensive search of peer-reviewed literature
USDA-NRCS National Resources Inventory (NRI) Data • Over 800,000 field sites across the conterminous U.S. • Data collected every 5 years • Associated soils database linked to NRI • Contains data on: • Land use • Cropping history (I.e. crop rotation) • Soils • Irrigation • Land set aside • Other information
DISSECTING THE LANDSCAPE ~5.3 Mha cropland in 102B ~1.25 Mha dominated by LOAM surface texture ~114,000 ha continuous cropped corn under no-till
IPCC method • designed as default national inventory procedure. • Estimates stock changes over a 20-year inventory period. • C(t) = C(n)*LUC_factor*input_factor*tillage_factor*area C = C(t) – C(t-20) • Native (reference) C stock and LUC factors (representing land use conversions) are soil and climate specific. • Input factor relates to level of C inputs (e.g. crop residues, manure, perennial vs annual crops. • Tillage factor relates to tillage intensity (i.e. intensive, reduced and no-till).
Climatic Regions of the U.S. Delineated using PRISM average precipitation and temperature summarized by MLRA according to the IPCC region definitions. Cool Temperate Dry Cool Temperate Moist Warm Temperate Moist Warm Temperate Moist Warm Temperate Dry Sub-Tropical Moist Sub-Tropical Dry
LAND USE Groupings Irrigated Cropland Continuous Row Crops Cont. Row Crops/Small Grains Continuous Small Grains Row Crop - Fallow Row Crop/Small Grain - Fallow Small Grains - Fallow Small Grains - Small Grains - Fallow Row Crop - Hay/Pasture Row Crop/Small Grains - Hay/Pasture Small Grains - Hay/Pasture Continuous Hay Continuous Pasture Vegetables in Rotation Rice in Rotation Low Residue Annuals (ie cotton, tobacco) Perennial and/or Horticultural Crops Conservation Reserve Program (CRP) Agricultural Land Rangeland Forest Urban Land Water Misc. Non Cropland Federal Land “No-Till” “Reduced Till” and “Conventional Till”
Century method • Dynamic simulation model of C stocks and fluxes for whole ecosystem; utilizes monthly time step. • Simulates cropland, grassland, forest and savanna – capable of representing land use and land management changes • Incorporates comprehensive suite of management activities and factors (i.e. crop type, fertilizer, residue mgmt, irrigation, drainage, manuring, grazing, burning, system conversion). • Incorporates changes in yields and C inputs over time as a potential major factor in soil C balance.
Conceptual View of Dynamic Modeling using Century MODELED SCENARIOS INPUT DATA Climatic Data Monthly Temperature Monthly Precipitation Tillage Changes No Till Reduced Tillage Conventional Tillage MLRA 108 Soil Characteristics Texture Drainage Land Use Changes CRP Abandoned farmland Converted to grassland Native Vegetation Rotation Changes Historical Cropping Practices Recent Cropping Practices Crop Rotation Tillage Fertilizer Irrigation Background image shows all MLRA’s that have more than 5% agricultural cropland.
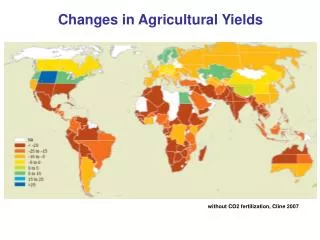
Estimated Annual C Sequestration in U.S. Agricultural Lands Mineral vs. Organic Soils 1997 Inventory
Carbon Sequestration in U.S. Agricultural Soils IPCC Inventory Approach 1982 to 1997 Analysis
Annual rates by ‘system’ changes Average rate of C change from 1982, ‘to’ management systems in 1997 to CRP to CRP to NT to NT to hay to hay stay as RT to RT stay as hay stay as CT to NT to RT to CT From annual crops, conventional till From annual crops, reduced till From hay
Century 21.2 MMTC yr-1 on 149 Mha cropland IPCC 20 MMTC yr-1 on 168 Mha cropland
Development of soil C stock monitoring network (incl. new measurement technologies) - integration with models More data on fluxes from cultivated organic soils Continued model development and validation Formal model uncertainty analysis Integration with top-down estimates (e.g. inverse modeling, flux-tower) at varying scales. Requires combining bottom-up estimates from all land use (forest, ag., grassland, urban) and energy emission sources. … on national-level quantification of soil C emissions/sinks
Economic/behavioral data for the systems of most importance (which may be new, unconventional) Issues of scaling – what level is necessary to capture key interactions between, e.g. soils, management and economics ? For example, if no-till is prevalent on poorer, erosion-prone areas? Can we develop formal uncertainty/confidence estimates for farmer or sector behavior in response to policy and economic signals – e.g. through analysis of past events? …on integrated assessments for policy