Download
1 / 93
930 likes | 1.28k Vues
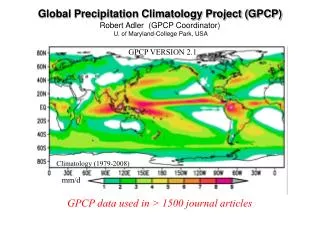
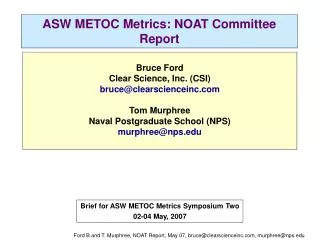
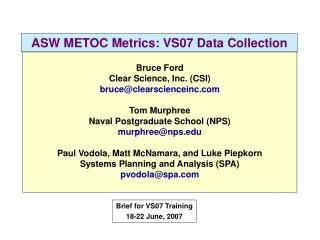
Smart Climatology for ASW and MIW: Data, Methods, Products, & Operational Implementation Tom Murphree, Ph.D. Naval Postgraduate School (NPS) murphree@nps.edu. Brief Presented at ASW / MIW Symposium CNMOC, 30 January 2008. ASW Smart Climo, murphree@nps.edu, Jan08. Authors

E N D
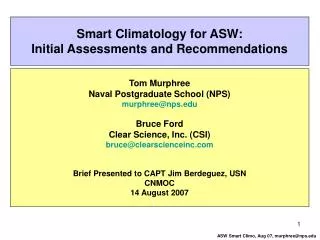
Smart Climatology for ASW and MIW: Data, Methods, Products, & Operational Implementation Tom Murphree, Ph.D. Naval Postgraduate School (NPS) murphree@nps.edu Brief Presented at ASW / MIW Symposium CNMOC, 30 January 2008 ASW Smart Climo, murphree@nps.edu, Jan08
Authors • Tom Murphree, NPS • Bruce Ford, Clear Science, Inc. • David Meyer, NPS • Katherine Twigg, Lt, Royal Navy, FNMOC • Paul Frederickson, NPS • Amalia Barrios, SPAWAR • Jeff Lerner, FNMOC • Dave Smarsh, Col, USAF • Karl Pfeiffer, Lt Col, USAF • Frank Price, LT, USN • Mark LaJoie, Lt Col, USAF • Adam Stepanek, Capt, USAF • Damon Vorhees, Capt, USAF • Joel Feldmeier, LCDR, USN • Chris Hanson, Capt, USAF • Sarah Moss, Capt, USAF • Bob Tournay, Capt, USAF • Christi Montgomery, LT, USN • Allon Turek, LCDR, USN • Chuck Wash, NPS • NPS climatology course students • In Coordination and Collaboration with: • CNMOC, NAVO, FNMOC, AFCCC/14WS, USAFE, AFRICOM • NCEP and other civilian climate research & operational climatology organizations The NPS Smart Climatology program precedes, and is not part of, the NRL RTP smart climatology project. ASW Smart Climo, murphree@nps.edu, Jan08
What is Smart Climatology? • Smart climatology: State-of-the-science basic and applied climatology that directly supports DoD operations • Smart climatology involves the use of state-of-the-science: • Data sets • Data access & visualization tools • Statistical & dynamical analyses • Climate modeling • Climate monitoring • Climate prediction • Climate scale decision analysis tools • for risk assessment, mitigation, & exploitation ASW Smart Climo, murphree@nps.edu, Jan08
Present State of DoD Climatology • Typical development of DoD climo products excludes many modern data sets and methods of climate analysis and forecasting. • This lag in DoD climatology has created significant gaps in climatological support for war fighters. • Course correction: Start applying smart climatology: State-of-the-art basic and applied climatology that directly supports DoD operations ASW Smart Climo, murphree@nps.edu, Jan08
Tier 3 Decision Layer Smart climatology based decision surfaces Tier 2 Performance Layer Smart climatological performance surfaces Tier 1 Environment Layer Smart climatological analyses & forecasts Observations Smart climatology data sets Satellites Fleet Data Initial and Boundary Conditions Smart Climatology and Battlespace on Demand Data and methods for generating smart climo products at all three tiers already exist, as do many prototype products. ASW Smart Climo, murphree@nps.edu, Jan08
Smart Climatology Existing Navy Climatology Limited Navy climatologies available. a b 20 cm/s Sea surface heights (cm) and surface currents (0-50 m; cm/s) for July in RIMPAC region: (a) smart climatology and (b) existing Navy climatology (no Navy climatologies exist for these variables). Smart climatology developed from existing civilian 47-year global ocean reanalysis. Smart Climatology – Data Sets Sea Surface Heights and Surface Currents Existing civilian smart climatology data sets provide descriptions of many variables that are not represented in Navy climatologies. Results from NPS Smart Climatology Program, murphree@nps.edu
Smart Climatology Existing Navy Climatology Limited Navy climatologies available. NECC NEC a b ci = 5.0 cm/s Long term mean ocean currents (cm/s) for August in VS07 region, 0-300 m depth: (a) smart climatology and (b) existing Navy climatology (no significant subsurface current data available in Navy climatologies). Smart climatology developed from existing civilian 47-year global ocean reanalysis. Smart Climatology – Data Sets Ocean Currents Existing civilian smart climatology data sets provide descriptions of many variables that are not represented in Navy climatologies. Results from NPS Smart Climatology Program, murphree@nps.edu
b a Evaporation duct height (m) for September from: (a) NPS smart EDH climatology and (b) existing Navy climatology. NPS smart climatology developed from existing civilian multi-decadal atmospheric and oceanic reanalyses. Smart Climatology – Data Sets Evaporation Duct Heights Smart Climatology Existing Navy Climatology Smart climo uses modern data sets, modeling, and visualization tools to produce more detailed, accurate, and operationally useful products. Results from NPS Smart Climatology Program: NPS thesis research by K. Twigg, Lt, RN. ASW Smart Climo, murphree@nps.edu, Jan08
b a Evaporation duct height (m) for September from: (a) NPS smart EDH climatology and (b) existing Navy climatology. NPS smart climatology developed from existing civilian multi-decadal atmospheric and oceanic reanalyses. Smart Climatology – Data Sets Evaporation Duct Heights Smart Climatology Existing Navy Climatology Data and methods available to develop comparable ocean smart climatology products. Smart climo uses modern data sets, modeling, and visualization tools to produce more detailed, accurate, and operationally useful products. Results from NPS Smart Climatology Program: NPS thesis research by K. Twigg, Lt, RN. ASW Smart Climo, murphree@nps.edu, Jan08
Smart Climatology Traditional Climatology T (oC) year SST (oC), East China Sea, Jul-Sep, 1969-2006. Note pronounced interannual variations and long term positive trend. Smart Climatology – Analysis Methods Long Term Fluctuations and Trends – SST, East China Sea, Jul-Sep Smart climo analyzes and monitors the evolution of the climate system, and updates climate statistics accordingly. Results from NPS Smart Climatology Program: Advanced Climatology course project. ASW Smart Climo, murphree@nps.edu, Jan08
Evaporation duct height anomalies (m) for Aug-Oct during positive phase of Indian Ocean Zonal Mode (IOZM). Smart climatology developed from existing civilian multi-decadal atmospheric and oceanic reanalyses. Smart Climatology – Analysis Methods Evaporation Duct Heights – Climate Anomaly Patterns Smart Climatology Traditional Climatology Data and methods available to develop comparable ocean smart climatology products. Not available Smart climo analyzes dominant modes of climate variability, especially relatively predictable variations, and accounts for those modes in operational products. Results from NPS Smart Climatology Program: NPS thesis research by K. Twigg, Lt, RN. ASW Smart Climo, murphree@nps.edu, Jan08
15 cm/s Smart Climatology – Analysis Methods Upper Ocean Currents, Nov-Mar, Long Term Mean (LTM) Note LTM poleward coastal currents along east Asia. Results based on 47-year global ocean reanalysis. From Ford and Murphree (2007) ASW Smart Climo, murphree@nps.edu, Jan08
Upper Ocean Current Anomalies, Nov-Mar, During El Nino Periods 6 cm/s Smart Climatology – Analysis Methods Note substantial strengthening (20-50% increase) of poleward coastal currents, and anomalous eddy activity in Kuroshio and Kuroshio extension, during El Nino periods compared to LTM. Changes in currents are indicative of related changes in upper ocean structure, SLD, BLG, etc. Results based on 47-year global ocean reanalysis. From Ford and Murphree (2007) ASW Smart Climo, murphree@nps.edu, Jan08
Smart Climatological Surface Currents, Gulf of Oman Long Term Mean La Nina Anomalies a b 1 cm/s 3 cm/s Surface currents in Gulf of Oman during Nov-Mar: (a) long term mean currents and (b) current anomalies during La Nina periods. Based on 47-year global ocean reanalysis. Note reversal of currents in Gulf of Oman. Smart Climatology – Analysis Methods Existing civilian smart climatology data sets allow development of conditional climatologies that account for deviations from long term means. Results from NPS Smart Climatology Program, murphree@nps.edu
Forecast Analysis Smart Climatology – Long Lead Prediction Probabilistic Prediction of Precipitation, Iraq, Oct-Dec Analyses of climate scale relationships (left) lead to climate predictions (right). Hindcast for Oct-Dec 2002, during moderate El Nino event, shows high (low) probability of above (below) normal precip. Lead time: six weeks, Verifying observed precip was 28% above normal. Conclusion from many such analyses and forecasts: Short term climate forecasts of T and precip in Southwest Asia have useful skill, especially compared to traditional climo. Apply to the ocean the short term climate prediction methods already used successfully for atmosphere. For example, develop smart climatology predictions of SLD, cutoff frequency, acoustic propagation. * Short term = one week to one year Results from NPS Smart Climatology Program: NPS thesis research by C. Hanson, Capt, USAF, and S. Moss, Capt, USAF. ASW Smart Climo, murphree@nps.edu, Jan08
TC Formation Probabilities for 01-07 Oct 2006 10% 25% 40% 55% 70% Verifying observations of TC formation sites during 01-07 Oct 2006 Results shown are from NPS hindcast. Experimental forecasts in development at NPS. Smart Climatology – Long Lead Prediction Tropical Cyclone Genesis Prediction, Western North Pacific Analyses of climate scale relationships between large scale environment and TCs leads to predictions of TC activity at leads of weeks to months. Apply smart climo methods to develop systems for producing weekly to seasonal predictions of the upper ocean and the atmosphere that drives it. See details in notes section of this slide. Results from NPS Smart Climatology Program: Based on NPS thesis research by LCDR D. Meyer. ASW Smart Climo, murphree@nps.edu, Jan08
TC Formation Probabilities for 01-07 Oct 2006 10% 25% 40% 55% 70% Verifying observations of TC formation sites during 01-07 Oct 2006 Results shown are from NPS hindcast. Experimental forecasts in development at NPS. Smart Climatology – Long Lead Prediction Tropical Cyclone Genesis Prediction, Western North Pacific Method very applicable to probabilistic forecasts of TC intensity and track. Analyses of climate scale relationships between large scale environment and TCs leads to predictions of TC activity at leads of weeks to months. Apply smart climo methods to develop systems for producing weekly to seasonal predictions of the upper ocean and the atmosphere that drives it. See details in notes section of this slide. Results from NPS Smart Climatology Program: Based on NPS thesis research by LCDR D. Meyer. ASW Smart Climo, murphree@nps.edu, Jan08
TC Formation Probabilities for 01-07 Oct 2006 10% 25% 40% 55% 70% Verifying observations of TC formation sites during 01-07 Oct 2006 Results shown are from NPS hindcast. Experimental forecasts in development at NPS. Smart Climatology – Long Lead Prediction Tropical Cyclone Genesis Prediction, Western North Pacific Basic method applicable to probabilistic forecasts of marine mammal location and migration. Analyses of climate scale relationships between large scale environment and TCs leads to predictions of TC activity at leads of weeks to months. Apply smart climo methods to develop systems for producing weekly to seasonal predictions of the upper ocean and the atmosphere that drives it. See details in notes section of this slide. Results from NPS Smart Climatology Program: Based on NPS thesis research by LCDR D. Meyer. ASW Smart Climo, murphree@nps.edu, Jan08
Surface Radar Detection Ranges Surface Radar Cutoff Frequencies a b (a) Surface radar detection ranges (km) based on NPS smart climatology for September. Values shown are long term means for September,for a C-band radar at 30 ft and detection threshold of 150 dB. (b) Cutoff frequencies (GHz) for surface radar for September. Based on application of existing civilian multi-decadal atmospheric and oceanic reanalyses, and existing sensor performance aids. Smart Climatology – Performance Surfaces Use of state-of-the-science data sets, analyses, and modeling can lead to substantial improvements in climate products. Need to develop related ocean climate environmental products, including, for example, smart climatological SLD products, and smart climatological performance surfaces for acoustic detection ranges and cutoff frequency. Results from NPS Smart Climatology Program: NPS thesis research by K. Twigg, Royal Navy. ASW Smart Climo, murphree@nps.edu, Jan08
Smart Climatology – Decision Support El Nino and La Nina Impacts on Military Operations, Taiwan, October Smart climatology puts state-of-the-science planning products in the hands of METOC personnel and end users. Results from NPS Smart Climatology Program: Advanced Climatology course project See details in notes section of this slide. ASW Smart Climo, murphree@nps.edu, Jan08
Smart Climatology – Decision Support Results from NPS Smart Climatology Program: NPS thesis research by D. Vorhees, Capt, USAF. ASW Smart Climo, murphree@nps.edu, Jan08
Smart Climatology: Civilian-Military Comparison * Status determined by assessment of overall, routine, operational climate support provided by AF and Navy (e.g., AFCCC, FNMOD, FNMOC, NAVO, OWSs, etc.), and by civilian organizations (e.g., NOAA, IRI, European agencies, industry, etc.). ASW Smart Climo, murphree@nps.edu, Jan08
Smart Climatology: What the Military Will Get If It Buys In ASW Smart Climo, murphree@nps.edu, Jan08
Smart Climatology – Readiness for Operational Transitioning * Transition status determined by assessing availability of: (1) substantial existing prototype products; and (2) operational products in civilian sector. For all elements, there are substantial products ready to begin transitioning. There are additional products which can be ready for transitioning within the next 6-18 months. ASW Smart Climo, murphree@nps.edu, Jan08
Smart Climatology – METOC Applications • Short range METOC applications of smart climatology • Environmental SA for analysts and forecasters • Deployment of METOC sensors (e.g., gliders) • QC-ing of observations • Improved model ICs, BCs, parameterizations, nudging, bias correction, and skill assessment for products at all 3 tiers • Long range METOC applications of smart climatology • Development of climate scale products at all 3 BonD tiers • Assessment of long lead uncertainty • Global climate change analyses • Development of probabilistic marine mammal climatologies ASW Smart Climo, murphree@nps.edu, Jan08
Smart Climatology – Customer Requirements & Applications • General requirement. State-of-the-science METOC support, including climate support. If there’s already a requirement for climate support, then there’s a requirement for smart climatology (although it may be an unfunded requirement if not ranked as a high priority). • Primary customers for smart climatology. All who need to plan at leads of a week or longer. • Customer applications of smart climatology • Environmental risk management and exploitation • OPLAN and CONPLAN development • Battlespace preparation • War gaming • Environmental aspects of R&A • SURTASS routing and ballasting • Screen placement • Marine mammal mitigation • Exercise time and location • Safety • Training ASW Smart Climo, murphree@nps.edu, Jan08
Gaps in Climatological Support of ASW More effort in weekly to seasonal smart climatology support could significantly improve operational effectiveness. Operational PlanningTeam Engagement MissionPlanning Cell Engagement OPLAN/CONPLAN Development EnvironmentalReconnaissance EnvironmentalReconstruction and Analysis Level of Impact Level of Effort COCOM Battlespace Prep Survey Program TAS TOS Mission execution briefs OPLAN/CONPLAN Studies ASW Smart Climo, Murphree@nps.edu, Jan 08 Years Months Weeks Days Hours Strategic Operational Tactical From ASW Coordination/CONOPs Conf 14 Mar 05; CAPT Jeff Best, CNMOC Director for ASW; CDR Van Gurley, CNMOC Deputy Director for ASW
Smart Climatology - Findings • Smart climatology has the potential to substantially improve climate support for warfighters. • The potential to make large improvements through short term climate prediction is especially high. • Shortfalls in DoD smart climo mean that warfighters are not being given state-of-the-science climate support. • We need a course correction We need to start providing smart climatological support. • Smart climatology data sets, methods, tools, and prototype products are ready now to be transitioned to operational use. • Smart climatology contributes to meeting several goals in CO’s guidance for 2008 (e.g., climate change, marine mammals, uncertainty, IUSS, warfighting focus, and workforce development goals). ASW Smart Climo, murphree@nps.edu, Jan08
Smart Climatology - Findings • Smart climatology has the potential to substantially improve climate support for warfighters. • The potential to make large improvements through short term climate prediction is especially high. • However, smart climo is not being done by DoD. • Thus, warfighters are not being given state-of-the-science climate support. • We need a course correction We need to start providing smart climatological support. • Smart climatology data sets, methods, tools, and prototype products are ready now to be transitioned to operational use. • Smart climatology contributes to meeting several goals in CO’s guidance for 2008 (e.g., climate change, marine mammals, uncertainty, IUSS, warfighting focus, and workforce development goals). Smart climatology can and should be integrated with CO’s other priorities (e.g., IUSS). ASW Smart Climo, murphree@nps.edu, Jan08
Smart Climatology – Recommendations to Leadership • Make operational implementation of smart climatology a priority for Naval Oceanography Enterprise. • Form a steering committee (R&D and operational METOC experts, end users) to map out the way ahead. • Be efficient. Build on existing resources, especially civilian climatology resources. • Get off to a fast start: Focus first on direct operational implementation ofexistingsmart climatology data and methods. Emphasize upcoming high profile events (e.g., RIMPAC08, west Pacific operations). • Teach smart climo at all levels, and then give military and civilian analysts and forecasters the tools to do smart climo themselves. Don’t leave smart climo up to just the climo R&D experts. • Take a joint Navy-Air Force approach. Consider creating a joint smart climatology reachback center. • Provide funding. ASW Smart Climo, murphree@nps.edu, Jan08
Pilot Study of Smart Climatology for ASW – VS07 • At request of CAPT Jim Berdeguez, developed prototype smart climatology products for ASW in August 2007. • Compared Navy atmospheric and oceanic climatologies to climatologies based on existing civilian atmospheric and oceanic reanalysis data sets. • Assessed value of providing state-of-the-science ocean climatologies for planning and execution of ASW operations. • Made recommendations for how to proceed with providing climatological support for ASW operations. ASW Smart Climo, Aug 07, murphree@nps.edu Acknowledgements: CAPT Jim Berdeguez, CDR Van Gurley, Dennis Krynen, staff of ASW RBC
Background Definitions and Concepts • Methods for Generating Climatologies • 1. Observations • Average all available observations for a given location and time of year. • Pros: Based strictly on observations, with no influence of statistical or dynamical methods for filling in temporal and spatial data gaps. • Cons: In data sparse regions (e.g., most of the ocean), there can be major data gaps. • 2. Observations with statistically-based filling of gaps • Use all available observations with data gaps filled via statistical methods (e.g., interpolation, correlation). Relies, in effect, on statistical model to fill in gaps. ManyNavy operational climatologiesgenerated using this method. • Pros: Relies on observations alone to develop statistical tools for filling gaps • Cons: Limited by the number of observations and the number of observed variables, especially in data sparse regions. No explicit check for dynamic consistency. • Observations with reanalysis-based filling of gaps • Uses all available observations with data gaps filled by data assimilation and dynamical models. This method used by many state-of-the-artcivilian operational climatologies. Reanalysis climatologies shown in this initial study use this method. • Pros: Data assimilation and dynamical models are well tested and yield dynamically balanced results. • Cons: In data sparse regions, results are strongly dependent on model. 48 ASW Smart Climo, murphree@nps.edu, Jan08
Climatologies Compared • Climatologies Based on Existing Civilian Reanalysis Data Sets • Simple Ocean Data Assimilation (SODA), V. 1.4.3 • NCEP Global Atmospheric Reanalysis • Navy Climatologies • Generalized Digital Environmental Model(GDEM), V. 3.0 • Surface Marine Gridded Climatology (SMGC), V. 2.0 ASW Smart Climo, murphree@nps.edu, Jan08
LTM Surface Wind Stress, August, From Reanalysis August LTM Wind Stress Magnitude and Direction (Base Period 1968-1996) N Pacific High Monsoon Trough E-erly trades SW-erly trades ITCZ N/m2 Note implied relationships between LTM patterns for wind stress and the LTM patterns for, and variability of (and uncertainty in), atmospheric convection, clouds, wind driven mixing, forcing of surface and internal ocean waves, MLD, SLD, BLG, atmospheric EDH, atmospheric EM propagation, etc. There are very large differences between the LTM winds associated with these stresses and the SMGC 2.0 winds provided for VS07 (not shown but available at VS07 page of Navy Oceanography Portal). The reanalysis winds are very similar to those from many prior observational studies, while the SMGC winds for VS07 are quite different. Thus, the reanalysis winds appear to be realistic, while the SMGC winds provided for VS07 are very questionable. From SODA oceanic reanalysis ASW Smart Climo, Aug 07, murphree@nps.edu
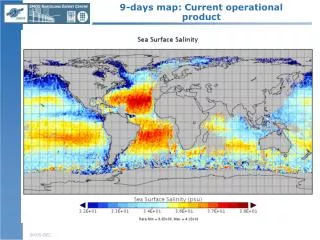
LTM Precipitation Rate, August, From Reanalysis mm/day Note high precipitation in monsoon trough and ITCZ. Prior studies have shown that precipitation in this region can have a significant impact on upper ocean structure (e.g., formation of low salinity and high temperature layers in upper few meters), which may then impact SVPs, SLDs, and other upper ocean acoustic features. Precipitation over the ocean is not available in any Navy climatologies. From NCEP atmospheric reanalysis ASW Smart Climo, Aug 07, murphree@nps.edu
LTM Temperature at 5 m, August, From Reanalysis oC • T ranges from low 29s to high 29s. • Warmest water roughly coincident with surface wind convergence zones (monsoon trough, ITCZ). From SODA oceanic reanalysis ASW Smart Climo, Aug 07, murphree@nps.edu
LTM Temperature at 4 m, August, from GDEM .0 oC • Comparisons of reanalysis T at 5 m and GDEM T at 4 m show: • GDEM cooler by ~0.5oC. This is a surprisingly large difference, since near-surface T is relatively well observed. • GDEM has more small scale structure (e.g., bulls eyes, patchy patterns). ASW Smart Climo, Aug 07, murphree@nps.edu
LTM Temperature at 5 m, August, from Reanalysis oC • This slide is the same as slide 30, but with a different color range used to highlight the • major patterns in the reanalysis T at 5 m data. • Compare to GDEM T at 4 m using color range that highlights major patterns (slide 33). From SODA oceanic reanalysis ASW Smart Climo, Aug 07, murphree@nps.edu
LTM Temperature at 5 m, August, from GDEM oC • This slide is the same as slide 31, but with a different color range used to highlight the major • patterns in the GDEM T at 4 m data. • Compare to reanalysis T at 5 m using a color range that highlights major patterns (slide 32). • Note the larger amount of small scale structure (e.g., bulls eyes, patchy patterns) in • GDEM than in the reanalysis (slide 32). Due to the statistical methods used in • GDEM to fill in data gaps? ASW Smart Climo, Aug 07, murphree@nps.edu
LTM Temperature Along 140E, August, From Reanalysis CI = 1.0 oC • Near-surface isothermal layer in upper 10-25 m. • Large meridional variations. • Main thermocline depth: 125-150 m at 5-10N; 150-250 m at 10-15N; 50-100 m at 15-20N. • Thermal structure consistent with velocity structure (see ocean current slides). From SODA oceanic reanalysis ASW Smart Climo, Aug 07, murphree@nps.edu
LTM Temperature Along 140E, August, From GDEM CI = 1.0 oC • Comparisons of T from reanalysis and GDEM show: • Overall patterns similar, but reanalysis warmer than GDEM, especially near surface. • GDEM near-surface isothermal layer deeper by ~10-35 m. • GDEM has more fine scale structure. Result of GDEM statistical methods used to fill in gaps? ASW Smart Climo, Aug 07, murphree@nps.edu
LTM Temperature Profiles, August, From Reanalyses ASW Smart Climo, Aug 07, murphree@nps.edu 64 From SODA oceanic reanalysis
LTM Temperature Profiles, August, From GDEM GDEM up to 0.5oC cooler than reanalyses in upper 30 m, with largest differences closest to surface. This is a surprisingly large difference, since near-surface T is relatively well known. This difference would lead to deeper SLD in GDEM than in reanalysis. Note: Near surface temperatures observed during VSO7 were, in general, ~0.5oC warmer than the long term mean reanalysis temperatures, and ~0.5-1.0oC warmer than the GDEM temperatures. The warmer waters appears to have been part of the 2007-08 La Nina event that was developing during August 2007. ASW Smart Climo, Aug 07, murphree@nps.edu ASW Smart Climo, Aug 07, murphree@nps.edu
Hypothesized Temperature Profiles, August Schematic T Profiles for Two Hypothesized Regimes, and for LTM of the Two Regimes Hypothesized Regime 1: Occurs during and soon after periods of high insolation and low winds (clear and calm conditions). May be enhanced if immediately preceded by high precipitation (e.g., surface freshening). Leads to shallower SLD. Regime 1 Profile Regime 2 Profile LTM of Regime 1 and 2 Profiles Hypothesized Regime 2: Occurs during and soon after periods of low insolation and high winds (e.g., deep convection with strong winds). May be enhanced if immediately preceded by high insolation, low-moderate winds (e.g., high evaporation, salinification). Leads to deeper SLD. If hypothesized profiles are common occurrences, then: (1) the reanalysis T profiles (shown in prior slide and similar to LTM profile in this slide) are probably realistic LTM profiles; and (2) the GDEM profiles (see prior slide) are probably less realistic LTM profiles, although they may be good depictions of Regime 2 conditions. This hypothesis can be tested using regime-based conditional climatologies developed from atmospheric and oceanic reanalyses (e.g., separate climatologies for high and low wind regimes). If a LTM represents opposing regimes, then two or more conditional climatologies may be more useful than a single LTM climatology. The high temporal resolution of reanalyses greatly facilitates development of such conditional climatologies. ASW Smart Climo, Aug 07, murphree@nps.edu
Reanalysis GDEM Differences in Temperature Profiles: Interpretations • Profile Shape • Reanalysis accounts for multiple regimes due to its greater temporal resolution. Thus it captures both cool and warm, and gives “rounded off” mean T profiles near surface. • Reanalysis model does not have sufficient vertical resolution to capture distinct ML, so it produces a rounded off profile. • Profile Magnitude • GDEM T profiles weighted toward 1950s-1960s when ocean, especially upper ocean, was cooler. • Ocean model used for reanalysis includes many SST observations, but GDEM does not. Thus, reanalysis (GDEM) tends to create relatively high (low) T near surface. ASW Smart Climo, Aug 07, murphree@nps.edu
LTM Sea Surface Height and Currents, 0-50 m, August, From Reanalysis Subtropical Gyre NEC NECC • Maximum speeds of about 25 cm/s in NEC, centered at ~11N. • Currents strongly linked to surface winds (speed, direction, and • horizontal shear). • SSH and currents not available from GDEM. 20 cm/s From SODA oceanic reanalysis ASW Smart Climo, Aug 07, murphree@nps.edu
LTM Zonal Current Along 140E, August, From Reanalysis NEC NECC CI = 5.0 cm/s • NECC max speeds > 25 cm/s at ~50 m. • Velocity structure consistent with thermal structure (see next slide). • Currents not available from GDEM. From SODA oceanic reanalysis ASW Smart Climo, Aug 07, murphree@nps.edu
Smart Climatology - VS07 Findings • Reanalysis-based atmospheric and oceanic climatologies have significant advantages over existing Navy climatologies. • Temporal resolution • Spatial resolution: equal to or greater • More variables • Ability to explicitly account for complex dynamical relationships (e.g., interactions of clouds, radiation, winds, and surface heat fluxes) • Much greater functionality in conducting operational climate analysis and forecasting. Example: ability to develop conditional climatologies (e.g., upper ocean climatology for high and low wind stress regimes) • Complex dynamics evident in reanalysis-based climatologies, but missing in Navy climatologies. • Strong wind stress convergence and curl, deep convection, and high spatial / temporal variability in the monsoon trough • High spatial / temporal variability in MLD due to variability in atmospheric forcing of upper ocean • Current advection, shear, and eddies ASW Smart Climo, Aug 07, murphree@nps.edu
Smart Climatology - VS07 Findings • Improved atmosphere-ocean information would aid ocean analysts and forecasters. • Improved information on climatology of: • Monsoon trough • Deep atmospheric convection and associated air-sea fluxes • On-going climate variations (e.g., emerging La Nina) • Improved climatology-based tools for evaluating in situ observations and model output • Improved access to and understanding of the use of satellite imagery in analyzing atmospheric forcing of ocean • Improved assessments of the accuracy of the atmospheric model output used to force ocean models ASW Smart Climo, Aug 07, murphree@nps.edu
Smart Climatology - VS07 Findings • Key concepts • Getting the atmosphere right is critical in getting the ocean right. • Especially true for ASW, because atmosphere-ocean interactions play large role in shaping upper ocean. • To get the small scale right, you first have to get the large scale right. • This is because smaller scale and higher frequency ocean features of importance in ASW are strongly related to larger scale and lower frequency variations of atmosphere-ocean climate system (e.g., shifts in location and intensity of monsoon trough; intraseasonal variations in wind stress; anomalies in SSH and currents; etc.). ASW Smart Climo, Aug 07, murphree@nps.edu