Download
1 / 36
360 likes | 375 Vues
This project aims to add a cost-effective multi-channel analyzer (MCA) function to APIC, measuring output pulse voltages and producing histograms. Implementing wireless data acquisition and control. Utilizing Python software and data analysis tools for the MAPIC project.

E N D
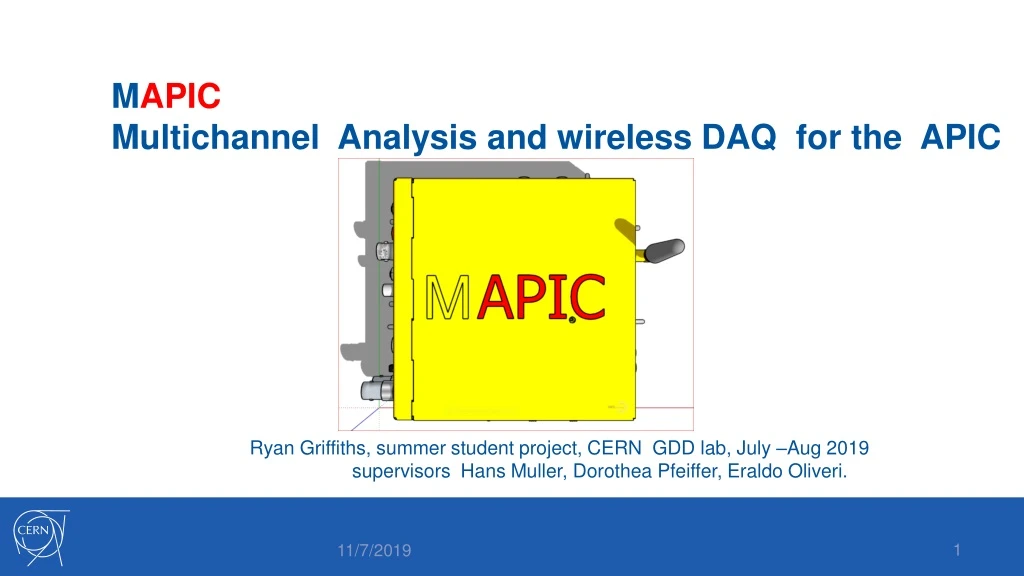
MAPIC Multichannel Analysis and wireless DAQ for the APIC Ryan Griffiths, summer student project, CERN GDD lab, July –Aug 2019 supervisors Hans Muller, Dorothea Pfeiffer, EraldoOliveri.
My Background Meadowlark: ://www.meadowlark.com/linear-series-spatial-light-modulator-p-121?mid=18 Summer student in the CERN GDD lab. Going into 4th year of physics degree at Durham University, UK. Background in microcontrollers, instrumentation and optics. Working on software and data analysis for the MAPIC project.
Motivation We want to add a multi channel analyser (MCA) function to the APIC. I.E we want to measure the voltage of output pulses from the APIC and produce a histogram. We want to do this more cheaply than commercial MCA ($4000) We want to implement wireless DAQ and control.
APIC Analogue OUT Detector IN The APIC box contains a preamplifier and shaper. Amplifies and shapes weak input pulse into a semi-gaussian.
APIC V4.x contains the essential subset of a bunch of NIM modules plus an external an CSA pre-amplifer + plus autonomous power from a Lithium Battery + plus a charge controller for small solar panels NEW addition 2019: Wifi - MCA
APIC shaper signal ( input to pulse stretcher) APIC Plugin: Peak stretcher board, Stretch peaks from the APIC so that they can be sampled with slow ADC (~1MSps) + averaged. Pulse stretcher flat top output 15 us ( to SAR ADC input )
Python card. “Pyboard D” • WiFi 100 Mbps and USB Phy. • Coax Antenna plug • Three 12 bit SAR ADCs, at 2 MSps.
Test Sources for DAQ (3) GEM Detector (2) Internal APIC Test Pulses (1) Photodiode Pickup charge from bottom plate. Adjust APIC gain + calibrate stretcher. Regular pulses, all with charge of 1 million electrons. Can change gain + frequency. Photodiode ! with quartz window, it is sensitive to alpha particles. Functions as a pin diode. Transmit via Wi-Fi and plot histogram on laptop.
α Bragg peak with MAPIC (1) 241Am α Measured with pin diode Id-didactic: https://www.ld-didactic.de/software/524221en/Content/Appendix/Am241.htm AM-241 Spectrum Figure 1: ADC count vs number of counts for 10k samples of 241Am with pin diode.
(2) APIC Internal Test Pulses Select either positive or negative input polarity. Figure 2: ADC count vs number of counts for 10k samples the internal test pulses.
55Fe GEMSetup • Want to measure energy spectrum of 55Feradioactive isotope. • We should see two peaks, main peak (5.9keV) and escape peak (2.9keV) in 2:1 ratio of energies. • Calibrate ADU to energies. Max sample rate 2kHz
(3) 55FeSpectrum 100,000 samples at a rate of 2kHz. Large number of samples cut into overflow. What would we expect: Figure 3: ADC count vs number of counts for 55Fe measured with GEM detector.
Calibration Main Peak 5.9keV Peak ratio not 2:1 3000:1100 As mentioned before – we need a linearity calibration to find offset. Escape Peak 2.9keV
GITLAB REPO FEATURES • Readme instructions. • GUI control of APIC. • Saving experimental setup. • Wireless control of the APIC & readout. • Histogram data processing on PC side.
Software Tools On The Pyboard Micropython language. lwIP network sockets – Wi-Fi data streaming. STM32 HAL Drivers – extend Micropython. On The PC Python Tkinter GUI control. Python Matplotlib + NumPy for data processing. Python network sockets.
ADC Datalogging in MP • Interrupt on GPIO • ADC in poll mode • Add data to buffer, send if full • Clear stretched pulse with GPIO pulse Requires 3 pins and takes approximately 75us for 4us of ADC data! Sampling queue can overflow – runtime error. Limits performance to 1-2kHz sampling rate.
C Optimisation – HAL Analog Watchdog • Watchdog constantly monitors ADC values. • When outside of a threshold, generate an interrupt, peak occurred. Sample peak. • Could improve 75us peak to around 10us! Possible to reach 100kHz rate. • Also only uses ADC pin, simpler hardware needs.
Wireless Readout • Pyboard wireless access point: PYBD. • Bind socket to port 8080 • Laptop connected to PYBD. • Bind socket to port 8080. Performance up to 80Mb/s, fast data readout over Wi-Fi. Much faster than 8Mbps USB. Range of a couple of meters with only antenna, can be increased with a repeater.
Menu for connecting + saving default settings. TKinter GUI Use sliders to set value of the digital potentiometers. Measure rate of pulses + get calibration equation. Read digital potentiometer values/addresses on the pulse stretcher via I2C Error messages displayed here Up to 64-bit number of samples from ADC + progress bar Switch APIC polarity Set histogram features
Main Tasks and ToDo list Complete analog watchdog code. Calibrate the stretcher gain/offset to achieve correct 55Fe spectrum. Configure the three ADCs in triple interleaved mode to increase sampling time to 200ns?
MAPIC sampling modes PM= peak stretcher mode (slow ADC 2.4 Msps ) DM*= direct mode (fast ADC 7.2 Msps) tp= 450 ns Charge and timing measurements Noise and baseline measurements DM mode currently “in the works”
Conclusion Successfully implemented readout and APIC control over Wi-Fi. Functional Tkinter GUI with useful features. Close to implementing high performance C code to increase sample rate limit from 2kHz to ~100kHz.
Acknowledgements I would like to thank my supervisors: Hans Muller, Dorothea Pfeiffer and EraldoOliveri.
Transfer characteristics peak stretcher card V1.1 ADC dyn. range up 3.3V For final peak stretcher implementation: - refine linearity - reduce 187.77 mV input pulse offset - measure transfers function for all gains quasi linear Y = 1.43 X – 187.8 Auto-Cal function in final SW version Pre-measurement of transfer curve
APIC preamplifier-shaper chain* Driver Shaper tp=2 ts CSA PZ VGA OUT V(t)peak ~ Q(Dt) CSAmon Analogue to digitizer Rf Shieldcage Q from Detector 1/Cf => CSA gain Highpass Lowpass 2nd Order + pole-zero cancellation Spark protection Gain= 1 Cf 50 W + +/- Charge input 50 W / 1M -1 gain 15 - Charge injector | Baseline Baseline Variable/fixed 50 W CSA output tstep=charge collection tdis= discharge time 1/e CSA Gain 0-20 Uref tp short/long Shaper selector Switch -1 V(t) ~ Q/Cf [t/tp]2exp{ 2 [t/tp] } 50 W Analogue monitoring CA direct out (50W/1M) preamp step function *simplified w.o. Test pulse and ToT trigger tp Upeak~ Q
APIC feature summary 1x built-in CSA preamplifier with spark protection - default trimmer set to 1mV/fC, 1us decay - triple-spark-filter << 1nA leak 3x AC/DC input coupling modes - direct DC, AC up 4 kV via slide switch: 360pF /4.7nF 1x detector Bias plug to detector - LRC filtered via SHV connector to AC input 1x direct CSA output - direct CSA output up +/- 1.1V 1MW, +/- 2.2V 50 W - output polarity = input charge - internal Pole-Z trimmer (pre-adjusted) 1x input for an external CSA preamplifier (SIPA) - internal CSA disabled, adjust internal Pole-Z trimmer - Signal input 50 Ohm Lemo-00, power cable Jack 1x testpulse generator 50 W LVTTL / NIM , 1M TLL - permanent or single toggle with LED - variable rate 1Hz..1 kHz via 15-turn potentiometer 1x test charge injector testpulse - 200ps neg / 700ps pos. int. test pulse 1.4V via 0.125pF 2x shapers -slide switches: 2 shapers, baseline zero/variable -Gamma-2 shape, default: tp,fast= 30ns, tp,slow =350ns 1x variable gain amplifier - CSA -> shaper gain 0 – 20 via 15-turn potentiometer - Gain Monitor Voltage plug (2mm Banana) 2x shaper outputs - complementary up +/- 1V 50 W , +/- 2V 1MW - 150 mV variable baseline +/- 1x dual polarity discriminator -> trigger generator - Trigger via 15- turn discriminator over +/-CSA polarity - TOT and TBT threshold over CSA signal slope 4 x Trigger LEDs: charge polarity and discriminator lock - red/blue : +/- input signal polarity level in range - orange/green: +/- TOT or TBT trigger locked 1x complementary 50 W NIM trigger output - TOT time-over-threshold (prompt, short) NIM signal - TBT time below threshold (prompt, short) NIM signal 1x 50 W NIM trigger pulse stretcher output* - 50ns-500ns out via 15- turn trimmer 1 x classic audible beep - audible beep from stretched NIM triggers 1 x 50 W -input for 3 selectable output functions (NIM 50 W ) - Input pulse stretching only* - input gated with TOT trigger, stretched - input gated with TBT trigger, stretched 1x optional HV bias generator ( for Si Diodes ) - 10V-100V low noise , temp. stable via 15 turn pot. • stretch prompt TOT/TBT triggers by connecting an external coax cable to input
Relative shaper CSA amplitudes The slide-switch selections (fast/slow) result in fast or slow peaking times ( default 25 ns/400ns) of approximately equal amplitudes*. The fast shaper selection applies to high-rate, low capacitance detectors with average rates up to 1 MHz. The slow shaper selection applies to low noise measurements of detectors up to Cdet ~ 1 nF * Can be tuned on request to +/-2% equality
Complementary shaper outputs The 2 shaper outputs are complementary with a common gain control. The non-inverted output has the same polarity as the input charge. Also the CSA output has the same polarity as the input charge.
APIC test pulse CSA preamplifier response to test charge Picosec test charge
APIC test pulser charge calculation DV amplitude = 1.39 V DQ*T = DV ~ CT[ 1- DV SRD pulser DQT Cf=1pF CT = 0.125 pF Cin = 5600 pF << 1 CT =0.125pF shaper -A Cin ~A*Cf DQT~ CT * CSA * ~ 1.081 Million electrons