Download
1 / 45
480 likes | 688 Vues
Explore the fundamental approaches to inventory management, such as Fixed Order Quantity and Fixed Order Interval models. Learn about demand types, mathematical formulations, EOQ calculations, trade-offs, and order replenishment strategies. Dive into inventory decision-making concepts and navigate through uncertainty with safety stock and inventory models.

E N D
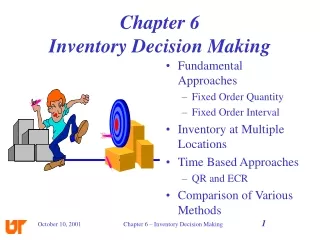
Chapter 6Inventory Decision Making • Fundamental Approaches • Fixed Order Quantity • Fixed Order Interval • Inventory at Multiple Locations • Time Based Approaches • QR and ECR • Comparison of Various Methods Chapter 6 – Inventory Decision Making
Team Hanes • Why was team Hanes profile included? • Volatility of demand • 5 day order turn around • 95% order fill rate • Account-specific price tagging • Why an athletic event supplier? • What happens at each level in the supply chain? Chapter 6 – Inventory Decision Making
Types of Demand • Nature of Demand • Independent vs. Dependent • Driver or Trigger of Order • Pull vs. Push or Hybrid • Company or Supply Chain Philosophy • System wide vs. Single-Facility Solution Chapter 6 – Inventory Decision Making
Basic Inventory Model Chapter 6 – Inventory Decision Making
Fixed Order Quantity (EOQ) Approach • Key Questions: • How much to reorder? • When to reorder? • To minimize total cost? • Two Tradeoffs • Inventory Carrying Costs • Order / Set-up Costs • Principle Assumptions (CBL, pp. 195) • Demand is continuous, constant, and known in advance • Lead time is constant and known in advance • Price of item is independent of order quantity Chapter 6 – Inventory Decision Making
Basic Tradeoffs • As order quantity (EOQ) increases: • Annual inventory carrying cost also increases • Annual ordering cost decreases • Example: MBL, pp. 196-198 Cost Annual Cost Cost Size of Order Quantity Chapter 6 – Inventory Decision Making
600 Units 400 1/2Q 200 20 40 60 Time Average InventorySlope = Demand/unit of timeInventory carrying cost = ½ Reorder Quantity X carrying cost Chapter 6 – Inventory Decision Making
Mathematical Formulation • Total Annual Cost = Annual Inventory Carrying Cost + Annual Ordering Cost • Letting TAC = Annual Total Cost ($) R = Annual demand (units) A = Cost of placing a single order ($) V = Value of one unit of inventory ($) W = Inventory carrying cost as a % of product value Q = EOQ • Then: TAC = 1/2 QVW + A (R/Q) • and: the EOQ that minimizes the TAC is: Chapter 6 – Inventory Decision Making
10 units = Example of EOQ R = Annual demand = 600 units A = Order cost = $4/order V = Product value = $240/unit W = inventory carrying cost = 20% = 0.20 Chapter 6 – Inventory Decision Making
Example of TAC: R = Annual demand = 600 units A = Order cost = $4/order V = Product value = $240/unit W = inventory carrying cost = 20% = 0.20 Then: TAC = 1/2 QVW + A (R/Q) 1/2 (10) (240) (0.20) + (4) (600/10) 240 + 240 $480 Chapter 6 – Inventory Decision Making
Second Question:When do you reorder? Chapter 6 – Inventory Decision Making
Reorder Point (when to order) The Goal is to have a shipment of EOQ units to arrive as the Balance-On-Hand > 0 Reorder Point (ROP) = minimum amount of inventory to last during the replenishment or lead time = [Lead time length (in days)] X [Demand per day (in units per day)] Continuing Example: (Assume 300 days per year) Lead time length = 12 days Then Demand per day = 600 / 300 = 2 units/day ROP = ( 12 days) ( 2 units/day) ROP = 24 units Additional exercises to do at home: CBL, pp. 230, #7 and 8 Chapter 6 – Inventory Decision Making
600 Units 400 200 24 20 40 60 Average InventorySlope = Demand/unit of timeInventory carrying cost = ½ Reorder Quantity X carrying cost Reorder Point Time Chapter 6 – Inventory Decision Making
Related Concepts • “Two-bin” system • “Min-max” system • demand may occur in larger increments than with the traditional EOQ approach Chapter 6 – Inventory Decision Making
But Life is not certain Chapter 6 – Inventory Decision Making
EOQ in Condition of Uncertainty • Uncertainty = variation in demand and/or lead time • Requires holding of safety stock inventory • Policy: Cost of carrying safety stock should be balanced with expected cost of stockouts • Average inventory = 1/2 EOQ + Safety Stock Chapter 6 – Inventory Decision Making
Qm Safety Stock Inventory Model UnderConditions of Uncertainty • EOQ is still the amount ordered each time • Assumes that over time, uncertainty periods balance out Inventory Level (Units) ROP Chapter 6 – Inventory Decision Making Time
Explanation of Graph • Demand rate changes slope • Varying demand during cycle can make line non linear • Lead time changes • Reorder point to receipt Chapter 6 – Inventory Decision Making
Anytime there is uncertainity • Balance cost of stock out with cost of additional inventory • Instead of planning on average demand and average lead time you plan on average plus X standard deviations • If you plan around mean you would stock out 50% of time Chapter 6 – Inventory Decision Making
Fixed Order Interval • Involves ordering of inventory at fixed or regular intervals • Amount order depends on how much is on-hand at the time of ordering (NOT EOQ) • Implications: • Does not require close surveillance of inventory levels • Inventory monitoring less expensive • Over time, it results in higher safety stock levels Chapter 6 – Inventory Decision Making
Fixed order quantity is not only option Fixed order interval Every Thursday End of month Each night Chapter 6 – Inventory Decision Making
$4,000 $3,000 Units $2,000 $1,000 1 2 3 4 5 1 2 3 4 5 1 2 3 4 5 1 2 Time (weeks) Fixed Interval Modal Chapter 6 – Inventory Decision Making
How many inventory locations should we have? Chapter 6 – Inventory Decision Making
Inventory at Multiple LocationsSquare Root Rule • How does total inventory change as the number of stocking points changes? • Let: n1 = number of existing facilities n2 = number of future facilities x1 = total inventory in present facilities x2 = total inventory in future facilities Chapter 6 – Inventory Decision Making
= 50,000 150,000 units = = 50,000 Example: Square Root Law • Currently, the company has 50,000 units located in 3 facilities. The company plans to expand to 27 locations. How will this affect total inventory? Chapter 6 – Inventory Decision Making
Are these the only way to replenish inventory? Chapter 6 – Inventory Decision Making
Human Nature likes safety stock • Retail has a need for 1000 units • Wholesaler wants to make sure they can handle retailers needs so they stock 1100 • Distributor wants to make sure they can handle wholesalers needs so they stock 1210 • Manufacturer wants to make sure they can handle distributor’s needs so they stock 1331 units • With four member in the supply chain over stock is 33.1% Chapter 6 – Inventory Decision Making
How do you avoid this problem? Chapter 6 – Inventory Decision Making
Time Based Approaches to Replenishment Logistics • Continuous Replenishment (CRP) Inventory Systems based on POS data • Flow-Through Logistics Systems (packing by destination) • Pipeline (Supply Chain) Logistics Organizations (exchange of information based on expected needs) • Pipeline Performance Measures (All members obtain data on performance at each level) Note: See Figure 6-12, MBL page 216 for further detail. Chapter 6 – Inventory Decision Making
P & G case • Why is P&G case presented? • What did it take to improve process? • What is demurrage? Chapter 6 – Inventory Decision Making
Quick Response (QR) • How did it evolve? • QR is a method of maximizing the efficiency of the supply chain by reducing inventory investment where partners commit to meet specific service performance criteria. • shorter, compressed time horizons • Real-time information by SKU • Seamless logistics network • Partnership relationships throughout the supply chain • Commitment to Quality • What were results? Chapter 6 – Inventory Decision Making
Basic Elementsof QR Chapter 6 – Inventory Decision Making
Faster Order Placement Shorter Lead Times Rapid Reaction to Demand More Reliable Lead Times Fast Response to Sales Trends Higher Sales Lower Markdowns Reduced Cycle Stock Reduced Safety Stock Lower Markdowns Higher Sales Greater Profitability Reduced Total Channel Costs QR Profit Sources Chapter 6 – Inventory Decision Making
66 46 21 Time Savings from QR Chapter 6 – Inventory Decision Making
Impact on Department Store • Joseph Haggar’s comments • Impact on Haggar • Impact on Dillards • ( See page 221-222) Chapter 6 – Inventory Decision Making
Efficient Consumer Response (ECR) Timely, accurate, paperless information flow Consumer Household Supplier Distributor Retail Store Smooth, continual product flow matched to consumption Source: Kurt Salmon Associates, Inc. Efficient Consumer Response: Enhancing Consumer Value in the Grocery Industry Chapter 6 – Inventory Decision Making
ECR Overview • Figure 6-18 (page 224) Chapter 6 – Inventory Decision Making
ECR • Components • Category management (Managing product groups as strategic business units) • Integrated electronic data interchange (EDI) • Activity-Based Costing (ABC) • Continuous replenishment programs • Flow-through cross-dock replenishment • Benefits • Better - products, assortments, in-stock performance, and prices • Leaner, faster, more responsive, less costly supply chain • Improved asset utilization Chapter 6 – Inventory Decision Making
Current Dry Good Chain Consumer Purchase Packing Line Suppler Warehouse 38 days Distributor Warehouse 40 days Retail Store 26 days 104 days ECR Dry Good Chain Suppler Warehouse 27 days Distributor Warehouse 12 days Retail Store 22 days 61 days ECR Impact on Dry Grocery Chain Chapter 6 – Inventory Decision Making
100 12.1 89.2 Operating Profit 9.8 18.3 Store Ops 16.4 5.0 Administration 4.8 8.1 Logistics 4.1 6.2 Selling/Buying 3.0 9.7 Marketing 8.2 Source: Food Marketing Inst., ECR, 1993. 42.7 Cost of Goods 40.8 ECR’s Effect on Cost Chapter 6 – Inventory Decision Making
Independent demand Pull/push Sales forecast based on past experience Single facility Dependent demand Push Requirements based on current and future demand Entire system Comparing EOQ and MRP EOQ MRP Chapter 6 – Inventory Decision Making
Part based Independent demand Pull/push Sales forecast based on past experience Single facility Product based Dependent demand Push Requirements based on current and future demand Entire system Comparing EOQ and MRP EOQ MRP Chapter 6 – Inventory Decision Making
Source: C. John Langley, Jr. Comparisons of Approaches Chapter 6 – Inventory Decision Making
Appendix 6A • You will not be responsible for Appendix 6 A. Chapter 6 – Inventory Decision Making