Graphing Linear Relations and Functions
Graphing Linear Relations and Functions. Objectives: Understand, draw, and determine if a relation is a function. Graph & write linear equations, determine domain and range. Understand and calculate slope. Domain & Range. A relation is a set of ordered pairs.

Graphing Linear Relations and Functions
E N D
Presentation Transcript
Graphing Linear Relations and Functions Objectives: • Understand, draw, and determine if a relation is a function. • Graph & write linear equations, determine domain and range. • Understand and calculate slope.
Domain & Range • A relation is a set of ordered pairs. • Domain: first components in the relation (independent) • Range: second components in the relation (dependent, the value depends on what the domain value is) • Functions are SPECIAL relations: A domain element corresponds to exactly ONE range element.
EXAMPLE • Consider the function: eye color • (assume all people have only one color, and it is not changeable) • It IS a function because when asked the eye color of each person, there is only one answer. • i.e. {(Joe, brown), (Mo, blue), (Mary, green), (Ava, brown), (Natalie, blue)} • NOTE: the range values are not necessarily unique.
Relations & Functions Relation: a set of ordered pairs Domain: the set of x-coordinates Range: the set of y-coordinates When writing the domain and range, do not repeat values!
Relations and Functions Given the relation: {(2, -6), (1, 4), (2, 4), (0,0), (1, -6), (3, 0)} State the domain: D: {0,1, 2, 3} State the range: R: {-6, 0, 4}
Relations and Functions • Relations can be written in several ways: • ordered pairs • table, graph • mapping. • We have already seen relations represented as ordered pairs.
Table {(3, 4), (7, 2), (0, -1), (-2, 2), (-5, 0), (3, 3)}
Mapping • Create two ovals with the domain on the left and the range on the right. • Elements are not repeated. • Connect elements of the domain with the corresponding elements in the range by drawing an arrow.
2 1 0 3 -6 4 0 Mapping {(2, -6), (1, 4), (2, 4), (0, 0), (1, -6), (3, 0)}
Functions • A function is a relation in which the members of the domain (x-values) DO NOT repeat. • So, for every x-value there is only one y-value that corresponds to it. • y-values can be repeated.
Functions • Discrete functions consist of points that are not connected. • Continuous functions can be graphed with a line or smooth curve and contain an infinite number of points.
Do the ordered pairs represent a function? {(3, 4), (7, 2), (0, -1), (-2, 2), (-5, 0), (3, 3)} No, 3 is repeated in the domain. {(4, 1), (5, 2), (8, 2), (9, 8)} Yes, no x-coordinate is repeated.
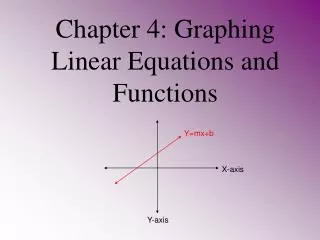
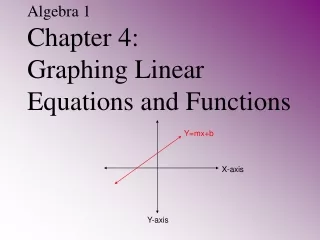
Graphing a function • Horizontal axis: x values • Vertical axis: y values • Plot points individually or use a graphing utility (calculator or computer algebra system) • Example:
Graphs of a Function Vertical Line Test: If a vertical line is passed over the graph and it intersects the graph in exactly one point, the graph represents a function.
x x y y Does the graph represent a function? Name the domain and range. Yes D: all reals R: all reals Yes D: all reals R: y ≥ -6
x x y y Does the graph represent a function? Name the domain and range. No D: x ≥ 1/2 R: all reals No D: all reals R: all reals
x x y y Does the graph represent a function? Name the domain and range. Yes D: all reals R: y ≥ -6 No D: x = 2 R: all reals
Can you identify domain & range from the graph? • Look horizontally. • What all x-values are contained in the graph? • That’s your domain! • Look vertically. • What all y-values are contained in the graph? • That’s your range!
Function Notation • When we know that a relation is a function, the “y” in the equation can be replaced with f(x). • f(x) is simply a notation to designate a function. It is pronounced ‘f’ of ‘x’. • The ‘f’ names the function, the ‘x’ tells the variable that is being used.
Value of a Function Since the equation y = x - 2 represents a function, we can also write it as f(x) = x - 2. Find f(4): f(4) = 4 - 2 f(4) = 2
Value of a Function If g(s) = 2s + 3, find g(-2). g(-2) = 2(-2) + 3 =-4 + 3 = -1 g(-2) = -1
Value of a Function If h(x) = x2 - x + 7, find h(2c). h(2c) = (2c)2 – (2c) + 7 = 4c2 - 2c + 7
HOMEWORK: • Complete worksheet packet • Worksheet packet due November 6th • Sit quietlyANDwork until the bell rings!!!!!