
ABSTRACT
Preparing for GOES-R: old tools with new perspectives Bernadette Connell, CIRA CSU, Fort Collins, Colorado, USA connell@cira.colostate.edu. ABSTRACT

ABSTRACT
E N D
Presentation Transcript
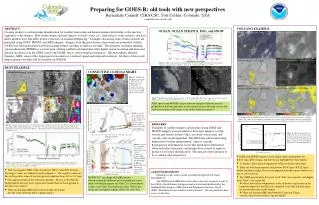
Preparing for GOES-R: old tools with new perspectivesBernadette Connell, CIRA CSU, Fort Collins, Colorado, USA connell@cira.colostate.edu ABSTRACT Creating products to aid in feature identification for weather forecasting and hazards requires knowledge of the spectral signatures of the features. How do the (hyper) spectral signals of clouds (water, ice), land surfaces, water surfaces, and dust differ and how does that affect products that rely on channel differencing? Examples discussing some of these features are presented using GOES, MODIS, and AIRS imagery. Imagery from the geostationary operational environmental satellite (GOES) has been particularly useful in tracking features and their evolution over time. The moderate resolution imaging spectroradiometer (MODIS) is a newer polar orbiting satellite instrument that offers higher spatial resolution and increased spectral resolution over the GOES sensor (the VISSR) but at a lower temporal frequency. The Atmospheric Infrared Sounder (AIRS) sensor offers hyperspectral resolution at a reduced spatial and temporal resolution. All three of these tools help us prepare for what will be available on GOES-R. VOLCANO EXAMPLE OCEAN, OCEAN STRATUS, FOG, and SNOW MODIS Aqua “true” color visible MODIS Aqua Infrared (11.0 μm) L M L M GOES Reflectance Product (3.9μm and 10.7μm) GOES BT(10.7μm) – BT(12.0μm) Figure 6. AIRS Aqua spectral plot of temperature versus wavelength for the shortwave and longwave region for a points shown on Figure 7. Data are for 19 November 2004 at 21:15 UTC. < Anatahan DUST EXAMPLE MODIS Reflectance Product (3.9μm, 10.7μm) MODIS Aqua “true” color visible CONVECTIVE CLOUD at NIGHT GOES Reflectance product (3.9μm and 10.7 μm) MODIS BTD 11.0 μm – 12.0 μm L M L M Figure 3. MODIS 11.0 μm image for November 4, 2002 at 06:25 UTC depicting convective cloud at night over Colombia. The squares show the locations of the sample points for AIRS data in Figures 4 and 5. Temperature difference high reflectance low reflectance MODIS Aqua BT(8.5μm) – BT(12.0μm) MODIS Aqua BT(11.0μm) – BT(12.0μm) high reflectance low reflectance Figure 7. MODIS Aqua satellite imagery products on 19 November 2004. The lettered squares shows the locations of AIRS samples points displayed in Figure 6: a) clear over ocean, b) ocean stratus, c) fog, and d) snow. GOES 10.7 μm channel MODIS true color product AIRS spectra and MODIS images demonstrating the different spectral properties in the long and short wave regions for less reflecting (ocean and snow) versus more reflecting (ocean stratus and fog) surfaces. L M L M Temperature difference Temperature difference Figure 4. Spectral plot of radiance vs. wavelength for the 3 points designated in Figure 3, with reference Planck function curves. Data are from AIRS for November 4, 2002 at 06:24 UTC. Figure 8. Satellite imagery products showing the volcanic ash and aerosol plume extending from Volcano Anatahan on 6 April 2005, GOES-9 and MODIS Aqua at 03:25 and 03:35 UTC respectively. The extent of the ash/aerosol plume is outlined. The outline was determined by tracking the ash over time on the GOES imagery. Regions L and M indicate thinner and thicker ash plume respectively and also designate where AIRS spectral profiles were sampled for Figure 9. REMARKS Examples of satellite imagery and products using GOES and MODIS imagery were presented to show how imagery is often viewed and various features (dust, ice cloud, water cloud, and volcanic ash) are distinguished. The AIRS data add an interesting dimension to feature interpretation. Since it contains hyperspectral ionformation, it provides much more information about individual data points and perspectives on how to improve products for feature identification. The data also show promise to be a valuable educational tool. high reflectance Figure 1. Satellite imagery products showing the dust plume extending from Colorado into Kansas and Nebraska on 18 April 2004, GOES-10 and MODIS Aqua at 19:30 UTC. The dashed line indicates the plume outline and the circle indicates the location for the dust point in Figure 2. The dashed outline was determined by tracking the dust over time on the GOES imagery. Figure 9. AIRS Aqua spectral plot of temperature versus wavelength for the shortwave and longwave region for one point each in region L and region M in Figure 8. Data are for 6 April 2005 at 03:36 UTC for the Anatahan eruption. Figure 5. Spectral plot of brightness temperature vs. wavelength for the 3 points designated in Figure 3. Data are from AIRS for November 4, 2002 at 06:24 UTC. The bandwidth of current GOES channels are also indicated. • GOES and MODIS imagery show similar values and patterns for BT(11.0μm)-BT(12.0μm) and they do not highlight the whole plume. • A “thicker” dust region designated by M has noticable reflectance. • There are both large negative and positive BT(8.5μm)- BT(12.0μm) within the plume region, but it is not apparent from this image whether it is due to ash or aerosol. • The AIRS spectral plots show low level “thin” ash (region L) and higher level “thick” ash (region M) • Notice the warmer temperatures in the shortwave region than in the longwave region for the thick ash compared to the thin ash indicating increased reflectance in the former. • There are missing AIRS data between 8.2μm and 8.8μm.. Are the values between these 2 points linear? Figure 2. AIRS Aqua spectral plot of temperature versus wavelength for the shortwave and longwave region for a point within the circle shown on Figure 1 representing thin dust, and a point to the east of this representing clear ground. Data are for 18 April 2004 at 19:30 UTC. • There are negative BTD values for dust for BT(11.0μm)-BT(12.0μm). The largest values are within the circle in Figure 1. The negative values are due to the positive slope of the dust spectral signature from 10.0 to 12.0 μm. • Dust appears bright in the reflectance product. Dust is cooler than the background in the long wave region and warmer than the back-ground in the short wave region. • There are missing AIRS data between 8.2μm and 8.8μm. Are the values between these 2 points linear? ACKNOWLEDGMENTS Funding for this work is made available through NOAA Grant NA67RJ0152. The MODIS and AIRS data used in this study were acquired as part of the NASA's Earth Science Enterprise and archived and distributed by the Goddard Earth Sciences (GES) Data and Information Services Center (DISC) Distributed Active Archive Center (DAAC). We are grateful to have access to this data. MODIS 10.7 μm image and AIRS spectra demonstrating the different spectral properties across many wavelength regions for “thick” ice cloud (points b and c) and “thin” low-mid level cloud. Notice the distinctive absorption regions (H2O, O3, and CO2).


