DETECTING TIME-JITTERING IN A CONNECTION CHAIN
210 likes | 344 Vues
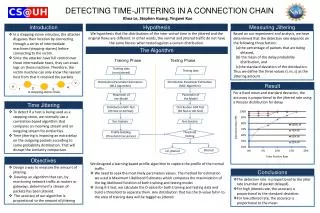
This research focuses on identifying time-jittering in network traffic to improve intrusion detection systems. We analyze the variance in inter-arrival times of packets, where jitter alters the gaps between them, affecting their probability distributions. By applying algorithms for maximum likelihood estimation and Goodness of Fit tests, we build profiles for normal and jittered traffic. Our findings highlight the dependencies of detection accuracy on packet delay percentages and distribution parameters, ultimately enhancing the detection of stealthy attacks like stepping-stone intrusions.

DETECTING TIME-JITTERING IN A CONNECTION CHAIN
E N D
Presentation Transcript
DETECTING TIME-JITTERING IN A CONNECTION CHAIN Khoa Le Mentor: Dr. Stephen Huang, YingweiKuo
M A D Stepping-Stone Intrusion B Internet C
Correlation-Based Approach Attack Time Jittering S1 ? Y Stepping-Stone Correlation Decision N S2 Normal
Detecting Time-Jittering Time-Jiterring Detection Decision Attack S1 N Y Stepping-Stone Correlation Decision N S2 Normal
Inter-arrival time (gaps) • The gaps between packets will change when jittering is applied. • Some gaps contract, while others expand • Resulting in different probability distributions
Hypothesis • The jittered traffic seems to fit lognormal distribution more than the normal traffic
Algorithm Training Data (Non-Chaffed) Testing Data Distribution Parameter Estimation (MLE Algorithm) Distribution Parameter Estimation (MLE Algorithm) Parameters of the Model Parameters of the Model Distribution GOF Test (KS Test or AD Test) Distribution GOF Test (KS Test or AD Test) Test Statistic Test Statistic Profile Building (Threshold Calculation) Threshold Testing Jittered Non-jittered
Parameters Estimation • Input: • A set of observed inter-arrival time {x1, ... , xn }, • The probability density function f(x) of a testing distribution model (Lognormal and Pareto distribution were used) • Least Squares, Maximum Likelihood Estimates, etc • Output: • The estimated parameters of the testing model.
Goodness of Fit (GOF) • Evaluate the “distance” (test statistic) between the data and the testing distribution • Kolmogorov-Smirnov Test, Anderson-Darling Test, etc
Kolmogorov-Smirnov Test D = max(|F(x)-G(x)|)
Profile Building • For every training data set, collect its test statistic. • Have a cluster of test statistics, called it the profile. • Any given traffic that does not have test statistic falling in that cluster is tagged as jittered traffic.
Testing Phase Training Data (Non-Chaffed) Testing Data Distribution Parameter Estimation (MLE Algorithm) Distribution Parameter Estimation (MLE Algorithm) Parameters of the Model Parameters of the Model Distribution GOF Test (KS Test or AD Test) Distribution GOF Test (KS Test or AD Test) Test Statistic Test Statistic Profile Building (Threshold Calculation) Threshold Testing Jittered Non-jittered
Testing Phase • For any given traffic, it goes through all the same procedures • Its test statistic will be tested against the threshold
Detection Rate • False Positive Rate • Falsely raise alarm when no jittering occurs • True Positive Rate • Raise alarm correctly
Detection Rate Example True Negative Rate False Negative Rate False Positive Rate True Positive Rate
Result • Accuracy depends on the following three factors: • The percentage of packets that are being delayed • The mean of the delaying probability distribution • The standard deviation of the distribution
Jittered Rate • For a fixed mean and standard deviation, the accuracy is proportional to the jittered rate
Standard Deviation • For high jittered rate, the accuracy is proportional to the standard deviation.
Mean • For low jittered rate, the accuracy • is proportional to the mean.
Summary of My Work • Implemented the algorithm on time-jittering • Analyzed the result • Drew conclusions about the behavior of the jittering effect