Download
1 / 23
230 likes | 368 Vues
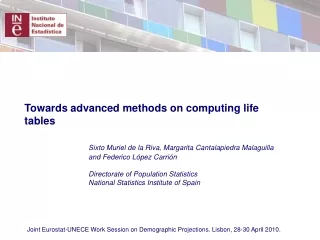
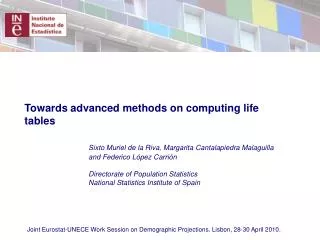
Towards advanced methods on computing life tables Sixto Muriel de la Riva, Margarita Cantalapiedra Malaguilla and Federico López Carrión Directorate of Population Statistics National Statistics Institute of Spain. New life tables methods in order to get some ambitous objectives.

E N D
Towards advanced methods on computing life tablesSixto Muriel de la Riva, Margarita Cantalapiedra Malaguilla and Federico López Carrión Directorate of Population Statistics National Statistics Institute of Spain Joint Eurostat-UNECE Work Session on Demographic Projections. Lisbon, 28-30 April 2010.
New life tables methods in order to get some ambitous objectives • Maximum use of available information. • Methodological consistency and rigor in definitions of biometric functions of the life table. • Capturing the annual incidence of mortality. • Accuracy on measuring mortality risks at advanced ages. • Regular measures of mortality incidence over subpopulations. • International comparability. • Easier interpretation of life tables results for users. Joint Eurostat-UNECE Work Session on Demographic Projections. Lisbon, 28-30 April 2010.
Three methods tested for national level Joint Eurostat-UNECE Work Session on Demographic Projections. Lisbon, 28-30 April 2010.
Option1: uniform distribution of deaths on Lexis squares Specific mortality rate by sex and age: Uniform time distribution of deaths within a year: a(x,s)=1/2 Probability of death by sex and age: Joint Eurostat-UNECE Work Session on Demographic Projections. Lisbon, 28-30 April 2010.
Option 2: uniform distribution of deaths on Lexis triangles Specific mortality rate by sex and age (following HMD protocols): Probability of death by sex and age: Joint Eurostat-UNECE Work Session on Demographic Projections. Lisbon, 28-30 April 2010.
Specific mortality rate by sex and age: b= (+) b= (-) X+1 Average number of year lived in the last year of live: X t Option 3: real time distribution of death events Why do not we use all available information we have? Joint Eurostat-UNECE Work Session on Demographic Projections. Lisbon, 28-30 April 2010.
Differences in mortality curve are negligibles... Joint Eurostat-UNECE Work Session on Demographic Projections. Lisbon, 28-30 April 2010.
…except for advanced ages Joint Eurostat-UNECE Work Session on Demographic Projections. Lisbon, 28-30 April 2010.
Deviations in mortality risk are due to the different estimation of a(x) too Joint Eurostat-UNECE Work Session on Demographic Projections. Lisbon, 28-30 April 2010.
In spite of all, life expectancy shows a robust behaviour… Joint Eurostat-UNECE Work Session on Demographic Projections. Lisbon, 28-30 April 2010.
…but options 1 and 2 shows a light underestimation of life expectancy Joint Eurostat-UNECE Work Session on Demographic Projections. Lisbon, 28-30 April 2010.
Conclussions related to national life tables • The three options capture annual incidence of mortality. • The three options keep methodological consistency. • Option 3 maximizes the use of all available data. • Option 3 reachs the highest accuracy in measuring mortality incidence and life expectancies. Joint Eurostat-UNECE Work Session on Demographic Projections. Lisbon, 28-30 April 2010.
Three methods tested for regions and provinces Joint Eurostat-UNECE Work Session on Demographic Projections. Lisbon, 28-30 April 2010.
Option 1: abbreviated life tables by five years age intervals Specific mortality rate by sex and age: Average number of year lived in the last group of years of life: Joint Eurostat-UNECE Work Session on Demographic Projections. Lisbon, 28-30 April 2010.
Option 2: aggregated results by five years of age groups from complete life tables From a complete life table survivors function (l(x,s)) and stationary population (L(x,n,s) Deaths serie: Probability of dying: Average number of year lived in the last goup of years of life: Joint Eurostat-UNECE Work Session on Demographic Projections. Lisbon, 28-30 April 2010.
Option 3: complete life tables adjusted by the Brass logits method Relation between regional and national survivors (logits): Deaths serie: Probability of dying: Joint Eurostat-UNECE Work Session on Demographic Projections. Lisbon, 28-30 April 2010.
Option 1 does not avoid the effect of the age structure within each age group… Joint Eurostat-UNECE Work Session on Demographic Projections. Lisbon, 28-30 April 2010.
…and, consequently, option1 overestimates life expectancies Joint Eurostat-UNECE Work Session on Demographic Projections. Lisbon, 28-30 April 2010.
Neverthelles, sometimes the randomness of deaths data distorts the analysis Joint Eurostat-UNECE Work Session on Demographic Projections. Lisbon, 28-30 April 2010.
Option 3 provides detailed results, assuming light deviations from real data… Joint Eurostat-UNECE Work Session on Demographic Projections. Lisbon, 28-30 April 2010.
…however, option 3 imports distortions in life expectancy at advanced ages Joint Eurostat-UNECE Work Session on Demographic Projections. Lisbon, 28-30 April 2010.
Conclussions related to regional life tables • The three options avoid problems of small sizes populations: randomness of deaths data and lower accuracy of population estimates. • Option 1 does not clean the effect of age estructure of population within each age interval. • Option 3 provides detailed results by simple ages, but causes distorsions in advanced ages. • Option 2 keeps complete consistency with a complete life table, avoiding problems of small sizes populations. Joint Eurostat-UNECE Work Session on Demographic Projections. Lisbon, 28-30 April 2010.
Thank you for your attention Sixto Muriel de la Riva Deputy Director of Population Statistics National Statistics Institute of Spain simuriel@ine.es Joint Eurostat-UNECE Work Session on Demographic Projections. Lisbon, 28-30 April 2010.