Evaluation of Traffic Delay Reduction from Automatic Workzone Information Systems Using Micro-simulation
220 likes | 395 Vues
Evaluation of Traffic Delay Reduction from Automatic Workzone Information Systems Using Micro-simulation. Lianyu Chu CCIT, UC Berkeley Henry X. Liu Utah State University. Hee Kyung Kim UC Irvine Will Recker UC Irvine. OUTLINE. Introduction Methodology Model calibration Evaluation

Evaluation of Traffic Delay Reduction from Automatic Workzone Information Systems Using Micro-simulation
E N D
Presentation Transcript
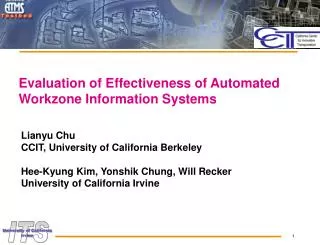
Evaluation of Traffic Delay Reduction from Automatic Workzone Information Systems Using Micro-simulation Lianyu Chu CCIT, UC Berkeley Henry X. Liu Utah State University Hee Kyung Kim UC Irvine Will Recker UC Irvine
OUTLINE • Introduction • Methodology • Model calibration • Evaluation • Conclusion
Introduction • Work zone • Noticeable source of accidents and congestion • AWIS: • Automated Workzone Information Systems • Components: • Sensors • Portable CMS • Central controller • Benefits: • Provide traffic information • Potentially • Improve safety • Enhance traffic system efficiency
Introduction (cont.) • AWIS systems in market • ADAPTIR by Scientex Corporation • CHIPS by ASTI • Smart Zone by ADDCO Traffic Group • TIPS by PDP Associates • Evaluation studies • Most • System functionalities • Reliability • Few • Effectiveness on safety, diversion
Objective & Approach • Effectiveness of AWIS in traffic delay reduction • Methods • Field operational test • Uncontrolled factors, e.g. incidents, variations of demands • Traffic analysis tools • Freq, QuickZone, QUEWZ • Difficulty in representing complicated traffic congestion analytically • Proposed method: • Microscopic simulation: Paramics • Model vehicles in fine details
Study site and CHIPS system • Site Location • City of Santa Clarita, 20 miles north of LA • On I-5: 4-lane freeway with the closure of one lane on the median side • Construction zone: 1.5 miles long • Parallel route: Old Road • Congestion: occurred in Holidays and Sundays • CHIPS configuration • 3 traffic sensors • 5 message signs
System Setup T = Queue being detected, F = No queue being detected • CMB06 : SOUTH 5/TRAFFIC/JAMMED, AUTOS/USE NEXT/EXIT • CMB07 : JAMMED/TO MAGIC/MOUNTAIN, EXPECT/10 MIN/DELAY • CMB08 : JAMMED/TO MAGIC/MOUNTAIN, EXPECT/15 MIN/DELAY • CMB09 : JAMMED TO MAGIC MTN, AVOID DELAY USE NEXT EXIT • CMB11: SOUTH 5 ALTERNAT ROUTE, AUTOS USE NEXT 2 EXITS
Evaluation methodology - Before-after study:
Building network • Based on • aerial photos • geometry maps • inputs: • roadway network, • traffic detection, • traffic control, • vehicle data, • driving behavior • route choice • traffic analysis zones
Calibration • Calibration: • Adjust model parameters to obtain a reasonable correspondence between the model and observed data • Time-consuming, tedious • Models need to be calibrated for the specific network and the intended applications • Methods • Trail-and-error method • Gradient- based and GA • Proposed 2-step method: • Calibrate driving behavior models • Simultaneous estimation of OD matrix and route choice
Data collection • Before: May 18th, 2003 • After: Sep 1st, 2003 (Labor Day) • Link flows: • 5 on-ramps and off-ramps • RTMS-1 and RTMS-3 • Loop detector station at Hasley Canyon Rd • Probe data • Two routes: • Mainline and the Old road • GPS-equipped vehicles
Calibrate driving behavior models • Calibrate capacities at major bottlenecks • Three parameters: • Mean headway • Drivers’ reaction time • Headway factor for mainline links • Trial-and-error method • Choose several parameter combinations • Check their performances - Mean headway = 0.9 - Drivers’ reaction time = 0.8
Simultaneous estimation of OD and routing parameters • Connected and affected each other • Formulated as • Solution algorithm: • two-stage heuristic search method • Assisted by Paramics OD estimator • using Paramics modeling engine • inputs s.t.
two-stage heuristic search method • Stage 1: Generate n sets of OD tables and routing parameters with Paramics OD estimator • (1) Choose n routing parameters θ1 to θn from multiple dimension parameter space. • (2) Let i = 1, set θ= θi. • (3) Estimate OD table Гi based on traffic counts at measurement locations. The objective function is: • (4) i = i+1. If i < n, go to step 3; otherwise go to the next stage.
two-stage heuristic search method • Stage 2: Evaluate these OD tables and routing parameters with Paramics Modeler. • (1) Let i = 1 • (2) Run Paramics simulation with OD table Гi and θi. • (3) Evaluate the estimated OD and routing parameters: • (4) i = i+1. If i < n, go to step 2, otherwise go to Step 5. • (5) Compare all MAPE(i), the lowest one corresponds to i = μ. • Therefore, Гμ and θμ are the best calibrated OD table and routing parameter.
Model calibration for step 2 • Route choice model in simulation models • Dynamic feedback assignment • Parameters: feedback cycle, compliance rate • Routing parameter θ: • 1 parameter: compliance rate • Inputs to OD estimator: • Reference OD table from planning model • 6 cordon flows • 5 measurement locations • Simulation period: 3-5 pm • Warm-up: 3-4 pm
Calibration results • Stage 1: • routing parameter θi : an estimated OD table Гi • Stage 2:
Evaluation • Run two simulation models: • Demand: after OD table • Before: • calibrated before network, 3% compliance rate • After: • Calibrated after network, 18% compliance rate • Number of simulation runs • Median run with respect to VHT
Conclusion • a microscopic simulation method to evaluate traffic delay reduction from AWIS • Calibration of two simulation models • two-step calibration • a simultaneous estimation of OD table and routing parameters • A two-stage heuristic solution algorithm • Evaluation: • AWIS can effectively • reduce traffic delay • Improve overall performance of the traffic system