Download
1 / 49
500 likes | 642 Vues
Learn why balance sheet reclassification is crucial for a coherent financial analysis. Understand the methods and rationale behind reclassification into liquidity and operations categories.

E N D
BALANCE SHEET RECLASSIFICATION RATIONALE AND METHODS
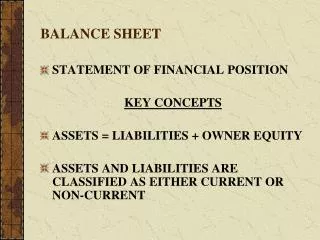
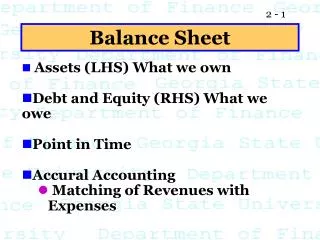
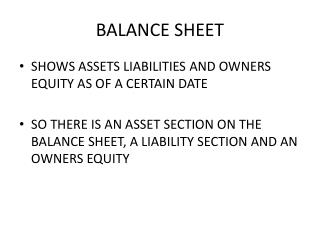
Premise • Financial accounts prepared according to the law have the advantage of being understandable in different countries • However they do not allow for an easy and coherent understanding of the firm’s financial results. Aggregation of items hinders some relevant features of firm’s financial position • BS and PL account reclassification is aimed at grouping items into homogeneous categories
Criteria There exist two criteria for BL and PL account reclassification BS PL Liquidity Management areas Sales and cost of goods sold Production and value added
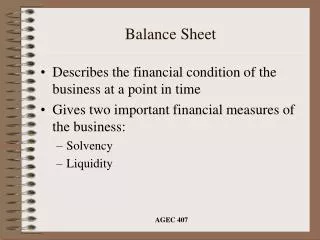
BS reclassification – Liquidity/Maturity • According to the liquidity/maturity criteria BS items are grouped as function of the time required to be transformed into cash • Liquidity: decreasing assets’ liquidity • Maturity: increasing liabilities maturity • It controls for correlation between assets and liabilities maturities
BS reclassification – Liquidity/Maturity Bank debt Bank overdrafts Debt Suppliers, tax debt, short term debt Liqudity Cash balances, short term securities Deferred liquidity Trade credit Disposables Inventories Short term debt Short lived asstes Long maturing liab Mortgages, Bonds Other long term debt Retirement Long term debt Tangible assets Plants, equippements Intangibles assets Trademarks, know-how, licenses Financial investments Participations, Long term securities Own funds (equity) Equity capital Reserves Profit/Loss Long lived assets E
BS reclassification-Liquidity/Maturity Strongly Unbalanced Poorly Balanced Well Balanced Short Term Liab - STL 25% STL 42% Liqud assets – L 25% L 25% L 25% STL 55% Long term Liab LTL - 22% D 27% Disposables – D 27% D 27% LTL 14% LTL - 30% E 44% FA 48% Fixed assets –FA 48% FA 48% Equity – E 53% E - 15% L<STL L+D<2xSTL E<FA L+D<STL+LTL LTL<1/2FA L<STL L+D<2xSTL E<FA L+D<STL+LTL LTL>1/2FA L=STL L+D>2xSTL E>FA L+D>STL+LTL LTL<1/2FA
Reclassification according to operations • BS items are grouped according to the area they belong to (current operations vs non current operations) • Current management comprises all typical business activities according to the specific business sector of the firm. It comprises purchases (raw materials), transformation and sale. Items: • Trade credit • Trade debt • Inventories • Fixed assets: they are operational assets not belonging to current operations • Cash balances and interest bearing liabilities?
Reclassification according to the operations Trade credits Inventories Other current assets Trade debt Other current liab (retirement, Tax debt) Current liabilities Operational current assets Bank debt (mortgages..) Bonds Other non current liab. Operationaltangibles OperationalIntangibles Operationalfinancialinvetsments Non current liabilities Operational non current fixed assets Equity Equity capital Reserves Profit/Losses Equity Cash balances Non operational assets Non current
Reclassification according to operations Trade debt Other current liab (retirement, Tax debt) Trade credits Inventories Other current assets Current liabilities Current operational assets Bank debt (mortgages..) Bonds Other non current liab. Operationaltangibles OperationalIntangibles Operationalfinancialinvetsments Non current liabilities Operational non current assets Equity Equity capital Reserves Profit/Losses Non operationalfixedassets Non operational assets Equity Non current, non operational assets Cash balances The Firm might run businesses outside the core business (ie. Renting a plant to a firm operating in another sector). Since such assets do not contribute to firm’s operations, they are included in non-operational assets
Reclassification according to operations • On a financial perspective, reclassifying balance sheet items according to the area they belong to is particularly important. It is useful for the purpose of analysing the dynamics in capital invested • In particular, it allows to gain understanding of changes in: • Commercial working capital (CCCN) • Operational net invested capital (ONIC) • Net invested capital (NIC)
Reclassification according to operations CURRENT LIABILITIES CURRENT ASSETS FINANCIAL LIABILITIES CCCN OPERATIONAL FIXED ASSETS EQUITY NON OPERATIONAL FIXED ASSETS CASH BALANCES WK + Operational net fixed assets = ONIC ONIC + Non operational fixed assets = NIC
Reclassification according to operations CA CA CL CL CCCN (-) CCCN (+) OFA FL FL OFA E E NOFA NOFA C C CCCN positive Lowering firm’s liquidity Limited ability to timely monetize revenues Limited ability to delay payments CCCN negative Improvingfirm’s liquidity Good ability to timely monetize revenues Good abilityto delay payments
Reclassification according to operations CURRENT LIABILITIES (CL) CURRENT ASSETS (CA) FINANCIAL LIABILITIES (FL) FINANCIAL LIABILITIES OPERATIONAL FIXED ASSTES (OFA) EQUITY (E) - NON OPERATIONAL FIXED ASSTES (NOFA) CASH BALANCES (C) CASH BALANCES = NFP positive FL>C Net Financial Position (NFP) FL<C NFP negative
Reclassification according to operations ASSETS (A) (INVESTMENTS) DEBT (D) According to a synthetic view, in the BS might be represented, through a single item, the total investments In such a representation CL are deducted from CA On the right side, there remain financial sources represented by NFP and (equity) CCCN EQUITY (E) A=CCCN + Fixed assets D=NFP=FL-C
Reclassification-Liquidity/Maturity Treasury Margin=Liquidity+Def. Liq-Curr. Liab=-6743 Structure Margin=Own Funds-Fixed Assets=-21403
PL account reclassification – Sales and cost of goods sold • Reclassification here distinguishes between revenues (and cost) belonging to current operations (core business) from non current operations • Precisely, such a criteria allows to calculate a few relevant margins • In particular, (Ebit): operational revenues- operational costs. • Before it we can calculate the industrial gross margin • All items after Ebit belong to non current operations. We can find a few balances: • Balance of financial management • Balance of accessory management
PL account reclassification – Sales and costs of goods sold INDUSTRIAL OPERATIONS CURRENT OPERATIONS Non industrial management area FINANCIAL ACTIVITIES SUPPLEMENTARY ACTIVITIES NON CURRENT OPERATIONS NON-RECURRING ACTIVITIES TAX MANAGEMENT AREA
PL account reclassification – Production and value added • Such a criteria is aimed at measuring the value of production that the firm carried on in the fiscal year. Two relevant margins are calculated • Value of production. Corresponds to the value of all has been manufactured by the firm. Obtained subtracting to sales the cost of goods to be sold which didn’t benefit (in terms of value added) from firm’s production process • Value Added(VA). Value of production net of consumes (productive factors needed to feed production) • Abovementioned margins are gross of employee expenses and amortization. Net of these items we obtain: • Ebitda: it is the VA net of employee expenses. It is a good proxy of firm’s performance • Ebit: Ebit net of amortization. It provides the better representation of the accounting performance of the firm
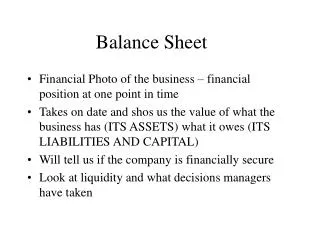
Two ways of analyzing the balance sheet • capital-employed perspective vs a solvency-and-liquidity perspective • Ce perspective: the Bs shows all the uses of funds and analyses the origin of its sources of funds. 3 purposes: • to understand how a company finances its operating assets; • to compute the rate of return either on capital employed or on equity and • as a first step to valuing the equity of a company as a going concern • In a solvency-and-liquidity analysis, a business is regarded as a set of assets and liabilities, the difference between them representing the book value of the equity. Three purposes: • to measure the solvency of a company; • to measure the liquidity of a company; and • as a first step to valuing its equity in a bankruptcy scenario
Two ways of analyzing the balance sheet The purpose of a capital-employed analysis of the balance sheet is to analyse the capital employed in the operating cycle and how this capital is financed
Book value of equity • This is a solvency-oriented concept that attempts to compute the funds invested by shareholders • It is an accounting, rather than financial, concept • BV equity: Fixed Assets+Current Assets-Borrowings of any kind • When a company is sold, the buyer will be keen to adopt an even stricter approach: • by factoring in contingent liabilities (which do not appear on the balance sheet); • by excluding worthless assets
ROE = ROA x Leverage x Contribution of rev/expenses outside operations ROE = EBIT/TAxTA/E xNI/EBIT It shows the contribution of: Operations (ROA) Capital structure, reflected by the leverage ratio, TA/CN, which exerts a multiplicative effect on the operational margin and on NI/EBIT The contribution of revenues/expenses outside operations (NI/EBIT), such as interest expenses The effect of capital structure decisions is not clearly identified being splt into two indicators ROE
The contribution of operations Efficiency in the use of capital ROA = ROS x TURNOVER Economic efficiency
ROE = [ ROA + (ROA – I) x D/E ] x NI/CI D = Debt E = Equity NI = Net income CI = Current income = Operational margin – Interest expenses (IE) I = IE/D = respresents an accounting estimate of the cost of debt ROE-An alternative approach
NI = [EBIT - IE] (NI/CI) NI/E = [EBIT/E - IE/E] (NI/CI) ROE = [EBIT/TA * TA/E - IE/D * D/E] (NI/CI) ROE = [ROA * (D+E)/E - IE/D * D/E] (NI/CI) ROE = [ROA * (D/E + E/E) - IE/D * D/E] (NI/CI) ROE = [ROA*E/E + ROA * D/E - IE/D*D/E] (NI/CI) ROE = [ROA + ( ROA - I )* D/E] (NI/CI) ROE-an alternative approach
ROE = [ ROA + (ROA – I) x D/E ] x NI/CI ROE depends on: operations (ROA) Capital structure: cost of debt and leverage ratio Income items outside operations: NI/CI. Excluding extraordinary revenues/expenses, the ratio becomes 1-T, where T is the tax rate ROE = [ ROA + (ROA – I) x D/E ] x (1-T) ROE-An alternative approach
An important topic in financial analysis pertains to the distinction between realized and unrealized income Suppose you your assets, net of liab., are worth 120k € at the end of the period (100k at the beginning) and you receive 70k in wages in the period What your income? Many people would say 90k… …but not the accountant, according to whom your income is just 70k (he recognize only realized gains rather than paper gains) A non-accontant, by contrast, would say that your spending power, ignoring inflation, is the commonsense 90k (after all, if you sell your assets you could realize those 20k) Economic income vs accounting income
ROE=[ROA+(ROA - IE/D ) x D /E]xNI / CI ROE Return on equity Contribution from operations Contribution of Capital structure Contribution of Other businesses
IE 16 NI 7 CASE 1 IE/D 8% D 200 ROA 10% CE 300 EBIT 30 E 100 T 50% ROE 7%
ROE = [ ROA x E + ( ROA - I ) x D] x NI / CI ROE-Breakdown E E
ROE = [ ROA x E +( ROA - I ) x D ] x NI / CI + = 4% 10% ROE-Breakdown ROA-i=2% D/E=2 8% 10% 100 200 E E 2% 50% 7%
IE 23 NI 3.5 CASE 2 IE/D 9.2% D 250 ROA 10% CE 300 EBIT 30 E 50 T 50% ROE 7%
ROE = [ ROA x E +( ROA - I ) x D ] x NI / CI + = 4% 10% ROE-Breakdown ROA-i=0.8% D/E=5 8% 10% 50 250 E E 0.8% 50% 7%
IE 8 NI 14 CASE 3 IE/D 8% D 100 ROA 12% CE 300 EBIT 36 E 200 T 50% ROE 7%
ROE = [ ROA x E +( ROA - I ) x D ] x NI/ CI + = 2% 12% ROE-Breakdown ROA-i=4% D/E=0.5 8% 12% 200 100 E E 4% 50% 7%
ROE = [ ROA + (ROA – I) x D/E ] x NI/CI Leverage: if (ROA - I) > 0 Rising the leverage ratio (D/E) allows pushing up ROE But: negative effects on risk!! ROE: focus on leverage
ROE breakdown: an extension ROE = ROA + D=Financial debt [(ROA - IE/D) X D/E + NFD=Non-financial debt (ROA - 0/NFD)X NFD/E] X (1-K)X(1-T) ROE = [ROA +(ROA-I) D/E + ROA X NFD/E] X (1-K) X (1-T) K = (CI – EBT) / CI T = (EBT - NI) / EBT Impact of other businesses CI = EBIT - IE Impact of taxes on the firm’s income
ROE • Is it a good indicator of the return on equity? • A company A with an higher ROE than company B, is for sure a better company? • Is an improvement in ROE inequivaocally a sign of improved performance? • Actually, ROE has three weaknesses as a performance indicator: • The problem of time • The problem of risk • The value problem
The problem of risk • The risk problem reflects the traditional risk-return trade-off • The ROE says nothing on the risk levels that a company assumes • Let consider the following example. Which of the two companies is the better? • To overcome the distortionary effects of leverage on ROE and ROA, its better to rely on the ROCE
ROCE: benefits • Let consider the following companies, identical except for their capital structure • Which judgement on ROE, ROA and ROCE?
The problem of value • ROE: based on the book value of equity • What if using the market value of equity? • Let suppose • Net earnings=107.2 • Book value of equity=983.8 • Market value of equity=1821.8 • ROE @ BV=107.2/983.8=10.9% • Earningyield=107.2/1821.8=5.9%
EBIT/IE • It is a ratio expressing financial fragility • Example: EBIT/IE=3; the firm has a 3 € margin to pay one € of IEs • Strengths: • Clear and unambiguous signals • It jointly considers both the economic and financial profiles of the firms • A low value for the ratio reveals financial fragility • Low operational margins? • Too high leverage?
EBIT/IE (EBIT/IE)=[(EBIT/S)*(S/D)]/(IE/D) Return on Sales Ratio of sales on debt Average accounting cost of debt
IE/S • Can be usedas a signal of finacilafragility • Itis the ratio of interestexpenses on sales • Actually, itis a «poor» substitute of the EBIT/IE ratio • Why?
IE/S • EXAMPLE: 5% IE/S ratio could alternatively be acceptable or too high • Let suppose a company having EBIT/S=10%... • …or, alternatively, =2%... • EBIT/IE is significant and immediately expressive of a firm’s financial soundness The ratio of IEs on sales increases…but against an increase in operational margins as well