Download
1 / 37
370 likes | 512 Vues
SCIAMACHY satellite validation during the field campaigns CINDI and TRANSBROM. Enno Peters, Folkard Wittrock, Andreas Richter, Mark Weber and John P. Burrows ENVIVAL-LIFE Meeting Bremen, 06/07.12.2010. Outline. Introduction 1. MAX-DOAS measurements

E N D
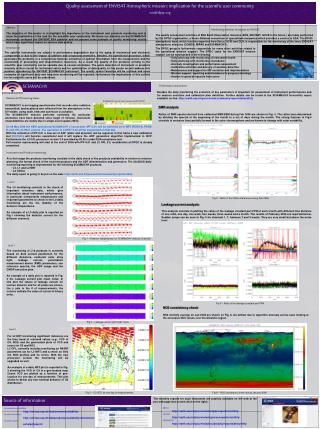
SCIAMACHY satellite validation during the field campaigns CINDI and TRANSBROM Enno Peters, Folkard Wittrock, Andreas Richter, Mark Weber and John P. Burrows ENVIVAL-LIFE Meeting Bremen, 06/07.12.2010
Outline • Introduction • 1. MAX-DOAS measurements • 2. Instrumentation (the ENVIVAL sponsored instrument) • II. The CINDI campaign • 1. Campaign overview • 2. Validation results (NO2, Ozone) • III. The TRANSBROM campaign • 1. Transbrom campaign overview • 2. Set up at ship, challenges • 3. Validation results (NO2, Ozone, HCHO) • IV. Summary
MAX-DOAS measurements Multi Axis - Differential Optical Absorption Spectroscopy • Measuring spectra of scattered sunlight • Deriving trace gas columns and profiles from absorption features • High sensitivity for stratospheric absorbers during twilight ( am and pm values) Spectrometers Light Telescope unit Y-shaped optical fibre Scheme of a MAX-DOAS instrument Zenith DOAS geometry
MAX-DOAS measurements Multi Axis - Differential Optical Absorption Spectroscopy • Measuring spectra of scattered sunlight • Deriving trace gas columns from absorption features • High sensitivity for stratospheric absorbers during twilight ( am and pm values) • High sensitivity for tropospheric absorbers using off-axis measurements • Converting slant columns into vertical columns/profilesusing radiative transfer models Spectrometers Light Telescope unit Y-shaped optical fibre Scheme of a MAX-DOAS instrument MAX-DOAS geometry
The Bremen MAX-DOAS campaign instrument Telescope unit: Optical bank with lens and optical fiber 30x30 cm metal box mounted on Pan/Tilt Head (+- 90° elevation, +-180° azimuth, 100°/sec) Video camera Entrance window (fused silica) Shutter for dark measurements, covered with PTFE (white) for calibration HgCd line lamp for calibration
The Bremen MAX-DOAS campaign instrument • Y-shaped optical fiber bundle in • UV-spectrometer: 315 – 384 nm • (0,033 nm/pixel, resolution ~ 0,4 nm) • Vis-spectrometer: 400 – 573 nm • (0,13 nm/pixel, resolution ~ 0,8 nm)
CINDI campaign - overview Cabauw Intercomparison campaign of Nitrogen Dioxide (NO2) measuring Instruments • Participating institutes:17 • Host: KNMI (Royal Dutch Meteorological Institute) • Location: Cabauw, Netherlands • June/July 2009 • Instruments: • 22 DOAS instruments • 4 NO/NOx in situ instruments • Lidars: Aerosol, NO2, trop. O3 • meteorologic systems • several NO2 sondes launched • during campaign • From Bremen: • 1 MAX-DOAS instrument • 1 NO/NOx in situ instrument www.geomon.eu
CINDI campaign - overview Location: Cabauw, Netherlands 51o 58' N 4o 55' E (semirural area) Cabauw tower (in situ instruments, meteo data) 287° ~ 43 km Elevation angle 2° Boundary Layer ~ 1.5 km 287° Remote sensing site, (DOAS instruments, Lidars)
NO2 tropospheric vertical columns NO2 trop. VC June/July 09 over Cabauw MAX-DOAS SCIAMACHY (r = 50 km) GOME-2 (r = 50 km) • Time resolution: 30 min • Spatial resolution: Satellite data averaged within 50 km around site Period of (mostly) good weather (esp. June 24 & 25 “Golden Days”).
NO2 tropospheric vertical columns NO2 trop. VC over Cabauw MAX-DOAS SCIAMACHY (r = 50 km) GOME-2 (r = 50 km) “Golden Day” June 25 Zoom in
NO2 tropospheric vertical columns NO2 trop. Columns and ground layer (BREAM profiling) comparison at June 25, 2009 MAX-DOAS SCIAMACHY (r = 50 km) GOME-2 (r = 50 km) VMR (ppb) Trop. Col. Morning inversion In situ monitor MAX-DOAS Ground Layer (profiling) For this day (almost no clouds, sunny) MAX-DOAS is successfully closing the gap between satellite measurements (huge spatial averaging) and in situ measurements (point measurements).
NO2 tropospheric vertical columns NO2 trop. VC over Cabauw MAX-DOAS SCIAMACHY (r = 50 km) GOME-2 (r = 50 km) “Golden Day” June 25 Great (by chance?) June 29 Highly dependant an location of the satellite pixel
Total Ozonecolumns MAX-DOAS measurements SCIAMACHY GOME-2 Criterion for coincidence between Satellite and MAX-DOAS: Satellite pixel within 200 km around measurement site at day of respective MAX-DOAS measurements average of these pixels
Total Ozonecolumns MAX-DOAS SCIAMACHY GOME-2 Criterion for coincidence between Satellite and MAX-DOAS: Satellite pixel within 200 km around measurement site at day of respective MAX-DOAS measurements average of these pixels
The TransBrom campaign Campaign‘s Logo RV „Sonne“ (Planned) Cruise track
Set up on the ship 270° 0° x x 180° 90° Relative winddirection between 90° and 180° is polluted (i.e. NO2)
Total NO2 NO2 vertical columns timeseries monthly average (at ~ 10 LT) SCIAMACHY GOME-2 MAX-DOAS morning MAX DOAS evening Criterion for coincidence: Satellite pixel within 200/400 km around ship‘s position at day of respective MAX-DOAS measurement Oct 10-12 maybe too polluted (or clean)
Tropospheric NO2 NO2 DSCD (298 K, 450 – 497 nm) 2° Elevation 8° Elevation 15° Elevation (Almost) no tropospheric NO2 over open ocean • SZA < 75°, Fiterror < 20% • Reference = closest 30° elevation spectrum • ( tropospheric NO2 content)
Tropospheric NO2 NO2 DSCD (298 K, 450 – 497 nm) 2° Elevation 8° Elevation 15° Elevation • SZA < 75°, Fiterror < 20% • Reference = closest 30° elevation spectrum • ( tropospheric NO2 content)
Tropospheric NO2 NO2 DSCD (298 K, 450 – 497 nm) 2° Elevation 8° Elevation 15° Elevation Ship density 10.10.- 23.10.2009 • SZA < 75°, Fiterror < 20% • Reference = closest 30° elevation spectrum • ( tropospheric NO2 content) Amver-data provided by Douglas Horton, CTR US Coast Guard Operations Systems Center (personal communication), www.amver.com
Tropospheric NO2 Zoom in event NO2 DSCD, Oct 10-11 Relative wind direction 2° Elevation 8° Elevation 15° Elevation • Rel. wind direction • ok during event • Positive peak • 2° higher SC than • upper elevation • Camera picture: • Other ship‘s plume Picture from the camera in the telescope box at 10.10.2009 23:20 UT
NO2 tropospheric vertical columns GOME2 trop. NO2 October 2009 NO2 trop. VC, October 10 - 12 MAX-DOAS GOME-2 (r = 150 km) SCIAMACHY (r = 150 km) monthly average (at ~ 10 LT) Detection Limit ~
NO2 tropospheric vertical columns GOME2 trop. NO2 October 2009 NO2 trop. VC, October 10 - 12 MAX-DOAS GOME-2 (r = 150 km) SCIAMACHY (r = 150 km) SCIAMACHY (r = 200 km) monthly average (at ~ 10 LT) Detection Limit ~
Total Ozonecolumns MAX-DOAS measurements SCIAMACHY GOME-2 Criterion for coincidence between Satellite and MAX-DOAS: Satellite pixel within 200 km (400 km) around ship‘s position at 10 LT at day of respective MAX-DOAS measurements average of these pixels
HCHO differential slant columns HCHO VCD (335 – 357 nm) Polluted region (ship traffic, influence from land) ? October 14: Sunniest day of the cruise anthropogenic, vegetation, lots of bush fires (dry season)
HCHO tropospheric vertical columns HCHO VCD (335 – 357 nm) Oct 19-20 cruise track October 19 ~ 150 km October 20 Detection Limit for vertical column ~ Oct 19: HCHO transport from vegetation (rainforest)?
HCHO tropospheric vertical columns HCHO from Satellite and MAX-DOAS MAX-DOAS (9-11 LT) Satellite (GOME-2) Data binned to 2°-grid. „Delay“ in MAX-DOAS increaseprobably due to bad weather at this time of the cruise.
HCHO tropospheric vertical columns obtained HCHO-column along ship track is pure background signal!
Summary • Validation (total Ozone,NO2 & HCHO) during 2 field campains in 2009 has been • perfomed. • CINDI campaign • SCIAMCHY and MAX-DOAS Ozone have same shape, MAX-DOAS VCs mostly • smaller than SCIAMACHY values • Loss (and recovery) of 80 DU Ozoneseen by both Satellite and MAX-DOAS • At particular days MAX-DOAS (via profiling, BREAM) is able to close the gap • between in situ point measurements and satellite(s) measurements of • tropospheric NO2 • TRANSBROM • SCIAMACHY and GOME-2 Ozone in good agreement with each other, smoothed • compared to MAX-DOAS • NO2 from SCIAMACHY and GOME-2 in good agreement with each other and • MAX-DOAS, eventropospheric NO2 • HCHO background level during whole campaign (from methane oxidation) in good • agreement with GOME-2