Download
1 / 18
190 likes | 520 Vues
Cellular respiration Fermentation Metabolism BMR. Carbohydrate Metabolism. The body’s preferred source to produce cellular energy (ATP) Glucose (blood sugar) is the major digestive product and serves as fuel to make ATP. Figure 14.17. Metabolic Pathways Involved in Cellular Respiration.

E N D
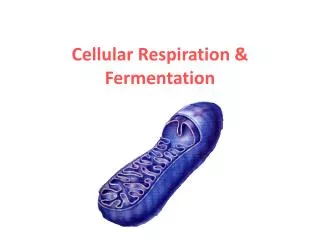
Cellular respiration Fermentation Metabolism BMR
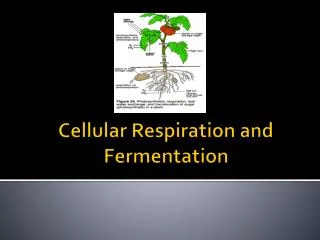
Carbohydrate Metabolism • The body’s preferred source to produce cellular energy (ATP) • Glucose (blood sugar) is the major digestive product and serves as fuel to make ATP Figure 14.17
Metabolic Pathways Involved in Cellular Respiration Figure 14.18
Glycolysis harvests chemical energy by oxidizing glucose to pyruvic acid Glucose Pyruvicacid Figure 6.9A Energy yield: 2 ATP and 2 NADH
Pyruvic acid is altered for the citric acid cycle Pyruvicacid Acetyl CoA(acetyl coenzyme A) CO2 Figure 6.10
The citric acid cycle completes the oxidation of organic fuel Acetyl CoA • enzymes convert acetyl to CO2 and generate NADH and FADH2 molecules 2 CITRIC ACID CYCLE CO2 Figure 6.11A
Steps in the Electron Transport System 1. Set up H+ gradient using energy of e- from NADH, FADH2 2. Downhill flow of H+ is used to make ATP Figure 3.28
cell outer membrane inner membrane mitochondrion
High-energy electrons carried by NADH • An overview of cellular respiration GLYCOLYSIS ELECTRONTRANSPORT CHAINAND CHEMIOSMOSIS CITRIC ACIDCYCLE Glucose Pyruvicacid Cytoplasmicfluid Mitochondrion Figure 6.8
Fermentation is an anaerobic alternative to aerobic respiration • Without oxygen, cells can use glycolysis alone to produce small amounts of ATP • But a cell must replenish NAD+ Glucose Pyruvicacid
NAD+ is recycled • Contributes to muscle soreness • In lactic acid fermentation, pyruvic acid is converted to lactic acid GLYCOLYSIS 2 Pyruvicacid 2 Lactic acid Glucose Figure 6.15B
Food, such as peanuts • Pathways of molecular breakdown Polysaccharides Fats Proteins Sugars Glycerol Fatty acids Amino acids Amino groups Pyruvicacid ELECTRONTRANSPORT CHAINAND CHEMIOSMOSIS Glucose G3P AcetylCoA CITRIC ACIDSCYCLE GLYCOLYSIS Figure 6.16
ATP needed todrive biosynthesis • Biosynthesis of macromolecules from intermediates in cellular respiration GLUCOSE SYNTHESIS CITRIC ACIDCYCLE AcetylCoA Pyruvicacid G3P Glucose Aminogroups Amino acids Fatty acids Glycerol Sugars Proteins Fats Polyscaccharides Cells, tissues, organisms Figure 6.17
Body Energy Balance • Energy intake = total energy output (heat + work + energy storage) • Energy intake from food oxidation • Proteins, carbs have 4 Cal/gm • Fats have 9 Cal/gm • Energy output • Heat is usually about 60% • Storage energy is in the form of fat or glycogen
Regulation of Food Intake • Body weight is usually relatively stable • Energy intake and output remain about equal • Mechanisms that may regulate food intake • Levels of nutrients in the blood • Hormones: leptin, ghrelin • Body temperature • Psychological factors
Metabolic Rate and Body Heat Production • Basic metabolic rate (BMR) reflects the amount of energy spent per unit of time by a body at rest • Factors that influence BMR: • Body shape (height and weight), gender, body composition, age, stress, food intake, genetics • TMR = Total Metabolic Rate • Total energy spent, includes activity above BMR
Estimation of BMR • Johnson: your weight in kg (# lbs/2.2) x 24 (x 0.9 if female) = Calories per day • Your weight in kg (# lbs/2.2) x % lean mass males usually 82-88% females usually 75-82% Then check table (next slide)
ESTIMATION OF RESTING METABOLIC RATE (RMR) • BASED ON FAT-FREE BODY MASS (FFM) • FFM RMR FFM RMR FFM RMR • (kg) (kcal) (kg) (kcal) (kg) (kcal) • 30 1018 58 1623 86 2228 • 31 1040 59 1644 87 2249 • 32 1061 60 1666 88 2271 • 33 1083 61 168889 2299 • 34 1104 62 1709 90 2314 • 35 1126 63 1731 91 2336 • 36 1148 64 1752 92 2357 • 37 1169 65 1774 93 2379 • 38 1191 66 1796 94 2400 • 39 1212 67 1817 95 2422 • 40 1234 68 1839 96 2444 • 41 1256 691860 97 2465 • 42 1277 70 1882 98 2487 • 43 1299 71 1904 99 2508 • 44 1320 72 1925 100 2530 • 45 1342 73 1947 101 2552 • 46 1364 74 1968 102 2373 • 47 1385 75 1990 103 2595 • 48 1407 76 2012 104 2616 • 49 1428 77 2033 105 2638 • 50 145078 2055 106 2660 • 51 1472 79 2076 107 2681 • 52 1493 80 2098 106 2703 • 53 1515 81 2120 109 2724 • 54 1536 82 2141 110 2746 • 55 1558 83 2163 111 2768 • 56 1580 84 2184 112 2789 • 57 1601 85 2206 113 2811